
Abstract
The International Society for Clinical Electrophysiology of Vision (ISCEV) standard for full-field electroretinography (ERG) describes a minimum protocol for clinical testing but encourages additional ERG testing when appropriate. This ISCEV extended protocol describes methods to record and evaluate a light-adapted (LA) ERG stimulus–response series with increasing flash strengths. The LA ERG stimulus–response series (also referred to as the luminance–response or intensity–response series in the published literature) can characterise generalised cone system function more comprehensively than the ISCEV standard LA ERGs alone. The amplitude of LA ERG a-waves, arising from cones and cone off-bipolar cells, typically shows a saturating function. The LA ERG b-wave amplitudes, which arise primarily from activity of retinal bipolar cells, show an amplitude peak followed by a nonzero plateau (the “photopic hill” phenomenon). This ISCEV extended protocol specifies a stimulus–response series suitable to evaluate generalised dysfunction affecting the LA retina, to aid in distinguishing between the on- and off-responses of the cone system and to monitor ERG changes in these characteristics. The LA ERG stimulus–response series for a- and b-waves is recorded to a sequence of nine flash stimuli ranging from 0.03 to 300 cd s m−2, superimposed on a standard background of 30 cd m−2. A shorter protocol is also presented to measure the mid-range of the function (the “photopic hill”) using 5 flash stimuli.
Introduction
The International Society for Clinical Electrophysiology of Vision (ISCEV) standard for full-field electroretinography (ERG) describes a minimum set of tests but encourages the use of additional ERG protocols for clinical ERG testing when appropriate [1]. This extended protocol describes methods of obtaining a stimulus–response series of light-adapted (LA) ERG a- and b-wave amplitudes. This series has also been called a “luminance–response” or an “intensity–response” series or the “photopic hill” phenomenon in many published studies. This ISCEV extended protocol is a specialised procedure that is well established and broadly accepted by experts in the field. The protocol was prepared by the authors in accordance with ISCEV procedures (http://www.iscev.org/standards/index.html) and was approved by the ISCEV Board of Directors on February 27, 2019.
Scope and applications
The ISCEV standard full-field ERG enables an assessment of generalised outer and inner retinal function relating to rod or cone systems and can help differentiate between a wide range of retinal disorders [2]. The addition of this extended protocol for the LA ERG stimulus–response series may improve the characterisation of LA retinal function, potentially enabling detection of more subtle changes such as early progression of disease or toxicity. For example, the method may reveal abnormalities to weaker and/or stronger flashes that are not evident in the standard LA 3.0 ERG and allows more comprehensive assessment of an abnormality detected with standard ERGs [3,4,5,6].
This extended protocol is designed to provide additional characterisation of cone system functions, particularly in retinal disorders with dysfunction that is post-phototransduction, or involves the inner nuclear layer of the retina. For brief, full-field flashes, the LA ERG a-wave stimulus–response series typically shows a saturating function [7, 8]. The b-wave series shows a peak followed by a nonzero plateau, also called the “photopic hill” [7, 9]. The reduction in the b-wave amplitude for strong flash stimuli is associated with a reduction in the d-wave amplitude [10] and therefore relates to cone off-responses [7, 8, 11]. Primate studies have shown two primary factors underlying the ‘photopic hill’ phenomenon: reduced on-response amplitude and a delayed and diminished off-response for strong flash stimuli [7].
The stimulus–response series for the LA ERG a-wave amplitude may help detect or characterise dysfunction relating primarily to the retinal pathways originating from the cone photoreceptors. The b-wave amplitudes may be informative particularly in conditions where cone-driven on- and off-responses are affected differently [3, 4, 8, 11, 12]. ISCEV has also established an extended protocol for the photopic On–Off ERG to long duration (i.e. light onset/offset) that may provide complementary information in such conditions [13]. The method described here utilises a range of brief flashes that include the ISCEV standard LA 3.0 ERG.
Patient population
This protocol is suitable for patients of all ages able to tolerate ganzfeld stimulation and referred for investigation of possible generalised cone system dysfunction, especially those with suspected dysfunction occurring post-phototransduction or at the level of the inner nuclear layer.
Technical issues
This extended protocol for the LA ERG stimulus–response series follows the basic patient preparation and requirements of the ISCEV standard full-field ERG [1]. Additional considerations are outlined below.
-
(a)
Light stimulators Typical light sources include light emitting diodes (LEDs) and xenon lamps. Typical xenon lamps will not discharge at the low voltages needed to produce weak flash levels; calibrated attenuation systems are required to use discharge lamps. Commercial systems with LED-based flash can provide accurate repeatable weak and moderate flash stimuli but may not be capable of achieving the strongest flash levels (see below).
-
(b)
Range of flash strengths To define the full LA ERG stimulus–response function for both the a- and b-waves, the stimulation system must be capable of delivering white flashes across a range from sub-threshold (in the absence of dysfunction < 0.1 cd s m−2) to saturating flash strengths. LA ERG b-wave saturation is typically achieved for flashes greater or equal to 100 cd s m−2; a-wave saturation requires stronger flashes of 300 cd s m−2 [14, 15]. An adequate number of flash strengths must be used to enable appropriate interpolation.
-
(c)
Flash duration Brief flashes within the integration time of the retinal photoreceptors (≤ 5 ms), are used. These do not directly separate the on- and off-responses of the retina. Strong flashes that saturate LA ERGs are more readily generated for brief, than for long-duration flashes and are less demanding for patients who may be unable to suppress blinking during longer light stimulation.
-
(d)
Photopic background A rod-suppressing background is used for light adaptation and to maintain cone system ERG selectivity during testing. The luminance of the background influences the LA ERG stimulus–response function. In general, stronger backgrounds shift the function to the right, i.e. stronger backgrounds require stronger flash stimuli to elicit similar ERG amplitudes and to enhance the peak amplitude and lower the saturated plateau of the b-wave “photopic hill”. Stimulus–response series recorded with different backgrounds are not comparable [4, 8, 10].
-
(e)
Inter-stimulus interval The ISCEV ERG standard specifies a minimum inter-stimulus interval of 0.5 s for the LA 3.0 ERG but does not specify intervals for weaker or stronger stimuli.
-
(f)
Signal amplitude and quality Small waveforms or responses of long peak time may be prone to proportionately greater noise or intrusion of blink and/or eye movement artefacts.
-
(g)
Nomenclature In many relevant publications, the flash stimulus strength is referred to as “luminance” and the LA ERG stimulus–response function referred to as the ERG “luminance–response” function. Brief flash stimuli are specified by the time-integrated luminance which is equivalent to luminous energy per unit solid angle per unit area or “strength” for simplicity [1, 16]. The term “flash luminance” implies time-integrated luminance while “luminance” or “intensity” alone do not correctly quantify brief flashes, these terms are retained in reference to published or historical data.
-
(h)
Linear interpolation of ERG amplitudes Plotting and linear interpolation of the amplitudes in the stimulus–response series helps to visualise the characteristics of the function and may provide more reliable comparisons than those based on individual ERG measurements. This can facilitate longitudinal monitoring and inter-laboratory comparisons. Plotting the series may facilitate identification of inconsistencies and outliers, particularly if the data are noisy.
-
(i)
Ocular pigmentation There is evidence that full-field ERG waveforms have larger amplitudes in those with lower levels of ocular pigmentation; the differences in amplitude associated with pigmentation have been shown to be the greatest for LA b-waves in some studies of the LA stimulus–response function [5, 17].
Protocol specification
This protocol follows the same procedures for patient preparation and recording that are outlined under the clinical protocol section of the ISCEV standard for full-field ERG [1], including mydriasis and a minimum of 10-min light adaptation prior to testing. This protocol may be used as a stand-alone method or integrated into the ISCEV standard full-field ERG protocol. Other specifications are listed below:
-
(a)
Range of flash strengths This protocol specifies the use of 8 brief (< 5 ms) flash stimuli across a range of at least 0.1 to 100 cd s m−2, with option of using an additional stronger flash, to examine a-wave saturation (Table 1). The stimuli differ in strength by equal logarithmic steps with a maximum increment of 0.5 log units and include the ISCEV ERG standard flash of 3.0 cd s m−2. Additional intermediate stimulus increments also comply with this extended protocol.
Table 1 Full-field flash stimuli for the LA ERG stimulus–response extended protocol For efficiency and patient convenience and comfort, a short protocol is also specified, with five flash stimuli within the range available from most commercial ERG systems. The short protocol is sufficient to identify the peak of the LA b-wave stimulus–response function (the “photopic hill”) in a typical healthy retina.
-
(b)
The photopic background This protocol specifies a photopic background of 30 cd m−2, as for ISCEV standard full-field ERG testing.
-
(c)
Flash sequence and repetition rate Flash stimuli for this protocol are presented from weak to strong with at least 0.5 s between flashes.
-
(d)
Response consistency Individual ERG waveforms should be assessed for repeatability and inconsistent or artefactual waveforms eliminated before averaging. The averaging of 3 to 10 trials for each stimulus is recommended to reduce variability and the effects of background noise. For weak stimuli, averaging up to 10 trials without blink or other artefact is typically sufficient to establish whether there is a detectable ERG.
Response evaluation
-
(a)
ERG measurement The peaks of the ERGs are measured according to the ISCEV standard ERG method [1]. Specifically, a-waves are measured from the trough to the average pre-stimulus baseline, b-waves are measured from the a-wave trough to the b-wave peak as shown in Fig. 1. ERG waveforms for some stimuli may contain poorly defined or multiple peaks. The a-wave is the lowest trough and the b-wave is the highest peak in the ERG waveform. To avoid the risk or measuring spurious or artefactual components, examiners should ensure that the peaks and troughs measured are reproducible and consistent with those of neighbouring flash strengths.
Fig. 1 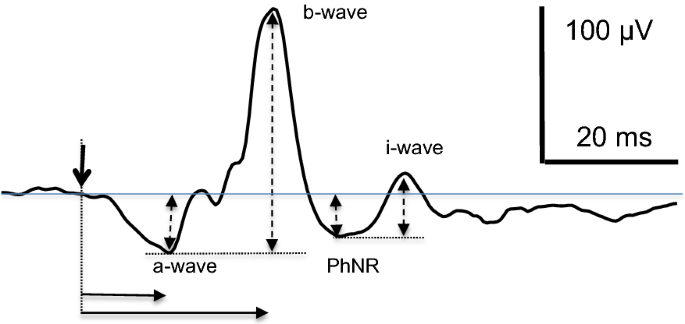
A typical averaged ERG recorded using a DTL electrode is illustrated for a 3 cd s m−2 flash with standard measurements. Peak times (solid horizontal arrows) are measured from the time of the flash (vertical solid arrow), a-wave amplitudes from the pre-stimulus baseline and b-waves amplitudes are measured from the trough of the a-wave (dashed vertical arrows). The PhNR and i-wave are illustrated for completeness but are not a part of this extended protocol
LA stimulus–response series are illustrated in Fig. 2 for a typical healthy adult and for a patient with the incomplete form of congenital stationary night blindness (CSNB2). Note the LA ERG series is not needed for the diagnosis of CSNB2; data are shown to illustrate one type of abnormality. In the typical adult, the ERG a-waves increase with the strength of the flash and reach saturation; b-waves increase to a maximum for mid-range flash stimuli then are of longer peak time and diminished for stronger stimuli, reaching an amplitude plateau. Patients with CSNB2 have abnormal signal transmissions from photoreceptors to on- and off-bipolar cells [19,20,21]. In the LA ERG series illustrated, the a-wave amplitudes are similar to typical a-waves for weak stimuli but are prolonged for strong stimuli. In CSNB2, b-waves are recordable only in the mid-range due to the impaired signal transmission from photoreceptors resulting in reduced on- and off-bipolar cell activity.
Fig. 2 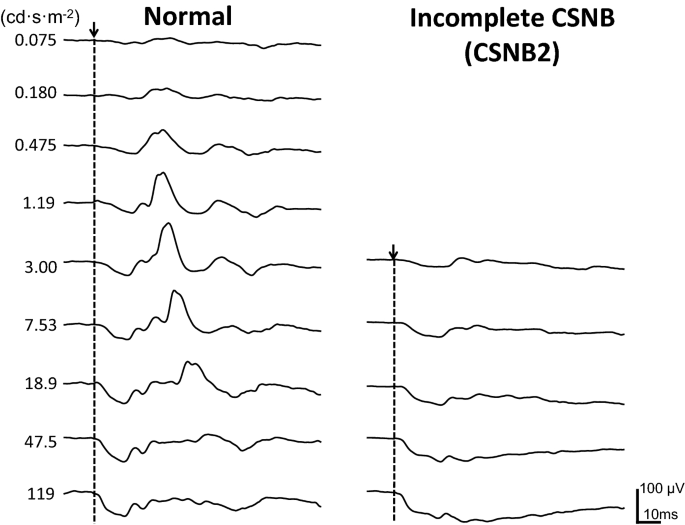
LA ERG stimulus–response series obtained from one participant with a healthy retina (left) and a patient with CSNB2 (right). The recordings were obtained using DTL electrodes to LED flashes on a 30 cd m−2 background. The strength of the flash stimulus (cd s m−2) is shown beside each ERG
-
(b)
Interpolation This extended protocol specifies plotting the averaged amplitudes from artefact-free ERG waveforms and using linear interpolation. Interpolation by curve-fitting produces parameters that can be objectively reproduced, which may further improve intra-laboratory comparisons. “Appendix 2” is a discussion of curve fitting, which requires sufficient, good-quality data; misleading parameters can result from insufficient or poor-quality data. Figure 3 illustrates b-wave amplitudes for typical LA ERG stimulus–response series with linear interpolation.
Fig. 3 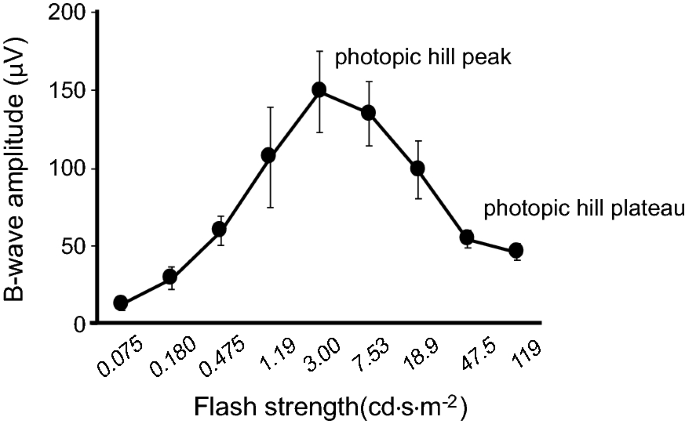
ERG b-wave amplitudes for the LA ERG stimulus–response series are shown for five typical young adults (mean ± SD) with linear interpolation. The data were recorded to an increasing flash strength in 0.4 log unit steps
-
(c)
B-wave amplitude; short protocol Data obtained using the short protocol (Table 1) will typically include the peak b-wave amplitude, but reliable estimation of the plateau region is precluded. Linear interpolation is recommended; a Gaussian curve fitting for the short protocol is discussed in “Appendix 2”.


Reporting
Reports should acknowledge the ISCEV extended LA ERG stimulus–response protocol, and the waveform components that have been analysed must be specified (a-waves and/or b-waves). Reports should also specify whether the full or short protocol was used and acknowledge any departures from ISCEV standard ERG methods and from this extended protocol.
Ocular pigmentation and high refractive errors may influence ERG amplitudes and patients with characteristics that differ from the reference data should be noted. Iris colour may be recorded as a good proxy for pigmentation of the ocular fundus [22, 23]. Each laboratory should establish or confirm typical reference values for its own equipment, recording protocols and patient population giving attention to appropriate sample sizes. Any technical or compliance difficulties such as excessive eye movements or eye closure should be noted.
Individual measures of amplitude and peak time for a- and b-waves for the ISCEV standard LA 3.0 ERG and for the ERG to the strongest flash stimulus used should be reported. Interpolated amplitude parameters for the LA ERG stimulus–response series may be noted from linear interpolation (Fig. 3) or from curve-fitting procedures (“Appendix 2”). For a-waves, these include the saturated a-wave amplitude and an estimate of the flash strength at half-maximal amplitude (also called semi-saturation or sensitivity). For b-waves, the interpolated peak amplitude along with the flash luminance at the peak may be reported in addition to the amplitude of the plateau. The method of interpolation or curve fitting should be specified in the report. Table 2 lists the interpolated values to be reported for comprehensive characterisation. For some clinical applications interpolation of the function will not be possible (for example if amplitudes are small) or may not be necessary. A qualitative description of the stimulus–response function may be sufficient.
References
McCulloch D, Marmor M, Brigell M et al (2015) ISCEV Standard for full-field clinical electroretinography (2015 update). Doc Ophthalmol J Clin Electrophysiol Vis Off J Int Soc Clin Electrophysiol Vis 130(1):1–12. https://doi.org/10.1007/s10633-014-9473-7
Robson AG, Nilsson J, Li S et al (2018) ISCEV guide to visual electrodiagnostic procedures. Doc Ophthalmol 136(1):1–26. https://doi.org/10.1007/s10633-017-9621-y
Chaplin C, Borchert MS, Fink C, Garcia-Filion P, McCulloch DL (2009) Light-adapted electroretinograms in optic nerve hypoplasia. Doc Ophthalmol 119:123–132
Garon ML, Rufiange M, Hamilton R, McCulloch DL, Lachapelle P (2010) Asymmetrical growth of the photopic hill during the light adaptation effect. Doc Ophthalmol 121:177–187
Al Abdlseaed A, McTaggart Y, Ramage T, Hamilton R, McCulloch DL (2010) Light- and dark-adapted electroretinograms (ERGs) and ocular pigmentation: comparison of brown- and blue-eyed cohorts. Doc Ophthalmol 121:135–146
Constable PA, Gaigg SB, Bowler DM, Jägle H, Thompson DA (2016) Full-field electroretinogram in autism spectrum disorder. Doc Ophthalmol 132(2):83–99. https://doi.org/10.1007/s10633-016-9529-y
Ueno S, Kondo M, Niwa Y, Terasaki H, Miyake Y (2004) Luminance Dependence of Neural Components that Underlies the Primate Photopic Electroretinogram. Invest Ophthalmol Vis Sci 45(3):1033–1040. https://doi.org/10.1167/iovs.03-0657
Hamilton R, Bees MA, Chaplin CA, McCulloch DL (2007) The luminance-response function of the human photopic electroretinogram: a mathematical model. Vision Res 47:2968–2972
Wali N, Leguire LE (1992) The photopic hill: a new phenomenon of the light adapted electroretinogram. Doc Ophthalmol 80(4):335–342. https://doi.org/10.1007/BF00154382
Ueno S, Kondo M, Ueno M, Miyata K, Terasaki H, Miyake Y (2006) Contribution of retinal neurons to d-wave of primate photopic electroretinograms. Vision Res 46(5):658–664. https://doi.org/10.1016/j.visres.2005.05.026
Rufiange M, Dassa J, Dembinska O et al (2003) The photopic ERG luminance-response function (photopic hill): method of analysis and clinical application. Vision Res 43(12):1405–1412. https://doi.org/10.1016/S0042-6989(03)00118-4
Bouskila J, Javadi P, Palmour RM, Bouchard J-F, Ptito M (2014) Standardized full-field electroretinography in the Green Monkey (Chlorocebus sabaeus). PLoS ONE 9(10):111569
Sustar M, Holder GE, Kremers J et al (2018) ISCEV extended protocol for the photopic On–Off ERG. Doc Ophthalmol 136(3):199–206. https://doi.org/10.1007/s10633-018-9645-y
Hood DC, Birch DG (1995) Phototransduction in human cones measured using the a-wave of the ERG. Vis Res 35(20):2801–2810. https://doi.org/10.1016/0042-6989(95)00034-W
Lamb TD, Pugh EN (2006) Phototransduction, Dark Adaptation, and Rhodopsin Regeneration The Proctor Lecture. Invest Ophthalmol Vis Sci 47(12):5138–5152. https://doi.org/10.1167/iovs.06-0849
McCulloch DL, Hamilton R (2010) Essentials of photometry for clinical electrophysiology of vision. Doc Ophthalmol 121:77–84
Wali N, Leguire LE (1993) Fundus pigmentation and the electroretinographic luminance-response function. Doc Ophthalmol 84(1):61–69. https://doi.org/10.1007/BF01203283
Brigell M, Bach M, Barber C, Kawasaki K, Kooijman A (1998) Guidelines for calibration of stimulus and recording parameters used in clinical electrophysiology of vision. Doc Ophthalmol 95:1–14
Raghuram A, Hansen RM, Moskowitz A, Fulton AB (2013) Photoreceptor and postreceptor responses in congenital stationary night blindness. Invest Ophthalmol Vis Sci 54(7):4648–4658. https://doi.org/10.1167/iovs.13-12111
Kondo M, Ueno S, Piao CH, Miyake Y, Terasaki H (2008) Comparison of focal macular cone ERGs in complete-type congenital stationary night blindness and APB-treated monkeys. Vis Res 48(2):273–280. https://doi.org/10.1016/j.visres.2007.11.010
Zeitz C, Robson AG, Audo I (2015) Congenital stationary night blindness: an analysis and update of genotype–phenotype correlations and pathogenic mechanisms. Prog Retin Eye Res. https://doi.org/10.1016/j.preteyeres.2014.09.001
Robins AH (1973) Skin melanin content in blue-eyed and brown-eyed subjects. Hum Hered 23(1):13–18
Weiter JJ, Delori FC, Wing GL, Fitch KA (1986) Retinal pigment epithelial lipofuscin and melanin and choroidal melanin in human eyes. Invest Ophthalmol Vis Sci 27(2):145–152
Lachapelle P, Garon M, Jauffret C et al (2007) Mathematical analysis of the cone ERG photopic hill: clinical applications. Acta Ophthalmol Scand. https://doi.org/10.1111/j.1600-0420.2007.01063_3244.x
Acknowledgements
The authors are grateful to the ISCEV members for their constructive input into this document, in particular Radouil Tzekov, Naheed Kahn, Krzystof Penkala and Wojciech Lubinski’s team, Quintin Davis and Jan Kremers.
Author information
Authors and Affiliations
Corresponding author
Ethics declarations
Conflicts of interest
The authors have no conflicts of interest.
Statement of Human Rights
The study involved no research on Human participants and consent is not applicable.
Statement on the welfare of animals
The study involved no research on animals.
Informed consent
As this article does not contain any studies with human participants performed directly by any of the authors, the concept of informed consent is not applicable.
Additional information
Publisher's Note
Springer Nature remains neutral with regard to jurisdictional claims in published maps and institutional affiliations.
Appendices
Appendix 1: Experimental procedures excluded from this extended protocol
A literature review was performed using the Medline search engine, for human studies that used the words ERG and luminance–response or intensity–response or photopic hill. The LA ERG stimulus–response extended protocol described here excludes the following.
-
1.
Stimulus–response timing series. Analysis of a-wave and b-wave peak times is restricted to the standard and strongest flash responses. Only the a-wave and b-wave amplitudes are considered over the whole stimulus range.
-
2.
LA ERG components such as the i-wave and PhNR are not included.
-
3.
Interpolation of ERG amplitudes by fitting of mathematical equation(s) is not a requirement of this extended protocol. We have included a discussion of suitable mathematical functions in Appendix 2.
-
4.
This protocol specifies a single standard background and light adaptation (at least 10 min if previously dark adapted). Series with a range of background strengths and with partial light adaptation are beyond the scope of this protocol.
-
5.
Chromatic variations in flash stimuli are excluded from this extended protocol, i.e. ISCEV standard white is used.
-
6.
Studies and techniques for modelling LA ERG a-waves based on modelling the leading edge are excluded from the current considerations.
Appendix 2: Curve fitting of light-adapted ERG amplitudes
A range of software programs are available for nonlinear curve fitting. Fitting methods such as least-squares or bisquare weighting curve may be applied. Although strategies and evaluation of the quality of such nonlinear curve fitting is beyond the scope of this appendix, users should consider measures of goodness-of-fit (typically expressed as the minimal residual r-squared value or the standard deviation of the residuals). Here we describe the mathematical functions appropriate for fitting the amplitudes of ERG waveforms.
Curve fitting of a-wave amplitude A-waves are well described by a logistic growth function [7, 8] in the form:
where V is amplitude expressed in µV, I is time-integrated luminance with units of cd s m−2, Vmax is the maximum saturated amplitude (µV) and σ is the semi-saturated flash strength (the time-integrated luminance evoking a half-maximal a-wave amplitude in cd s m−2).
As shown in Fig. 4, light-adapted a-wave curve fitting is generally successful with a-wave amplitude data for the range of stimuli given in Table 1 (up to 300 cd s m−2). However, the curve is better defined by ensuring saturation of the a-wave with the addition of a strong flash at 1000 cd s m−2. In patients with abnormal retinal function, such very strong flash stimuli might be required for successful curve fitting.

LA ERG stimulus–response series for the a-wave of light-adapted ERGs from a typical healthy eye fitted with a logistic growth function (dashed line—Eq. 1)
The short protocol uses flashes up to 10 cd s m−2, which does not saturate the a-wave; therefore, the short protocol is insufficient for a-wave curve fitting. Those using the short protocol should evaluate the a-waves separately for each stimulus.
Curve fitting of b-wave amplitude—‘photopic hill’ protocol The stimulus–response function of the LA b-wave amplitude is complex; curve fitting using the sum of two equations, Gaussian and logistic, is a method to fit the entire function. This requires sufficient data to define the hill and plateau regions of the curve (4). Other options include fitting selected regions of the function, either the rising phase using a logistic curve (5) or the hill portion of the curve using a Gaussian curve.
The entire stimulus–response function for the LA b-wave amplitude can be fit using the photopic hill Eq. 2, comprising the sum of a logistic growth function and a Gaussian function:
where Vb is b-wave amplitude (µV), I is time-integrated luminance (cd s m−2), Gb is the maximum amplitude of the Gaussian component (µV), B is a measure of the width of the Gaussian component (cd s m−2), µ is the flash strength at the peak of the Gaussian component, Gb (cd s m−2), Vmax is the maximum saturated amplitude (µV) of the logistic component and σ is the semi-saturated time-integrated luminance (the flash strength that evokes a half-maximal response) for the logistic component (cd s m−2). The fitting can be simplified by fixing the Gaussian width, B, to a value of 1 without any substantial change to the fitting parameters [8, 24].
Figure 5 illustrates the photopic hill curve for a representative LA b-wave stimulus–response series, and Fig. 6 shows additional individual examples. Table 3 gives the parameter descriptions for Eq. 2.

Reproduced with permission Hamilton et al. [8]
Graphical representation of Eq. 2 with a representative set of ERG b-wave amplitude data (open circles). Thick grey line: Gaussian function. Thick black line: logistic growth function. Thin line: Eq. 2, the Gaussian and logistic growth functions, which sum to create the LA ERG stimulus–response curve or “photopic hill”.

Illustration of the inter-individual variability in photopic hill size and shape. Data are LA ERG b-wave amplitudes measured in 16 healthy adults with dilated pupils and varying levels of ocular pigmentation. Curves are best fits of Eq. 2
Regardless of curve-fitting strategy and the software used. Users should use caution as Eq. 2 will result in spurious fitting if there are insufficient points to clearly define the location of the b-wave peak and plateau regions of the photopic hill. Either the Gaussian function or the logistic growth function can inappropriately dominate the fitting of Eq. 2 if amplitudes from stronger flashes are excluded. Figure 7 illustrates how truncated stimulus ranges can generate spurious fitting parameters.

Graphical illustrations of least-squares curve fitting with Eq. 2 (black line). Red line: logistic growth curve; dashed green line: Gaussian curve. Identical b-wave amplitude data are shown for different ranges (X indicates excluded points). Equation 2 fits the full range of data well (upper left); the Gaussian curve dominates for the range of 0.03 to 30 cd s m−2(upper right); a spurious logistic growth curve results from fitting the short protocol, 0.1 to 10 cd s m−2 (lower left). Note that any sub-threshold (noise) data should be excluded from curve fitting. In this example, LA b-waves were undetectable for flashes below 0.1 cd s m−2
For the short version of this extended protocol (flashes from 0.3 to 30 cd s m−2), we recommend fitting b-wave amplitudes using a Gaussian curve without a logistic growth component. The Gaussian curve is symmetric so the descending portion will mirror the ascending portion; the ascending and peak portions can be suitably estimated. It is important that the Gaussian fitting excludes b-wave amplitudes in the ‘plateau’ range of the stimulus–response series as this provides a poorer fit and shifts the peak of the Gaussian curve to the left (Fig. 8).

A representative illustration of curve-fitting b-wave amplitude with a Gaussian curve (green line), which is virtually superimposed on the fit for Eq. 2 through the full data set (red line). It is important to exclude data points in the plateau region of the LA stimulus–response function (red X) to avoid spurious Gaussian fitting (grey line)
While curve fitting provides robust and repeatable analysis for ERG amplitude data, it may not be desirable under all circumstances. In particular, for clinical abnormalities with very small ERGs, if normative ranges are established either with curve fitting or by linear interpolation, illustration of amplitudes in the LA ERG stimulus–response series compared with the normal range is suitable rather than attempting to fit curves through low amplitude data.
Rights and permissions
Open Access This article is distributed under the terms of the Creative Commons Attribution 4.0 International License (http://creativecommons.org/licenses/by/4.0/), which permits unrestricted use, distribution, and reproduction in any medium, provided you give appropriate credit to the original author(s) and the source, provide a link to the Creative Commons license, and indicate if changes were made.
About this article

Cite this article
McCulloch, D.L., Kondo, M., Hamilton, R. et al. ISCEV extended protocol for the stimulus–response series for light-adapted full-field ERG. Doc Ophthalmol 138, 205–215 (2019). https://doi.org/10.1007/s10633-019-09685-8
Received:
Accepted:
Published:
Issue Date:
DOI: https://doi.org/10.1007/s10633-019-09685-8