
Abstract
Objectives
This article explores the merits of commercially-based survey data on crime through cross-validation with established crime metrics.
Methods
Using unpublished data from 166 countries covering the period between 2006 and 2019, the article describes the geographical distribution across global regions and trends over time of three types of common crime, homicide, and organised crime. The article then explores possible determinants of the geographical distributions through regressing prevalence rates against indices of poverty, inequality, proportion of youth, presence of criminal opportunities (wealth and urbanisation), and governance/rule of law.
Results
The results show that African and Latin American countries suffer from the highest levels of various types of crime across the board, followed by countries in Asia. European, North American and Australian countries experience intermediate or relatively low levels of most types of crime. Levels of common crime have dropped or stabilized globally except in Africa where they went up. Homicides have fallen almost universally. Trends in organised crime are diverging.
Conclusions
Dimensions of governance emerged as powerful determinants of levels of all types of crime. Important determinants of common crime besides governance were poverty, inequality, and proportion of youth. To some extent changes in these same characteristics of countries were found to be correlated with changes in levels of crime over the past fifteen years. The article concludes with a discussion of the study’s limitations and suggestions for further research.
Introduction
In this article we explore the merits of the newly available, commercially produced crime data from the Gallup World Poll (GWP), a household survey carried out annually in over 160 countries since 2006, containing questions on experiences with theft as well as with violence (assaults and muggings) (Gallup World Poll 2020). Given that the GWP surveys are behind a pay-wall and thus not publicly available, GWP data on common crime have been analysed sparsely in the criminological literature. To our knowledge, so far only Corcoran and her colleagues have used GWP data to study the cross-national variation in experiences with violence (assaults and muggings) during the period 2006–2013 (Corcoran and Stark 2018, 2020; Corcoran et al. 2018). In this article we will expand their analyses by also examining GWP data on experiences with another type of common crime, i.e. theft. Furthermore, we expand our analyses by analysing data over a longer period, i.e. the full period since the start of the GWP-survey (2006) and 2019.
We first describe the geographical distribution across global regions, sub-regions and countries in people’s experiences with theft and violence in 160 countries for the five-year periods 2006–2009, 2010–2014, 2015–2019 and for the entire 14-year period 2006–2019. Second, we describe the trends over time in countries’ levels of experienced thefts and violence, and examine whether these levels have increased, decreased or stayed stable over the 14-year period. Next, we will look at intercorrelations between prevalence rates of common crime (i.e. both theft and violence) and non-common crimes (homicide, and organised crime/corruption). Finally, we will use our dataset on the prevalence of these types of crime to examine whether and to what extent often used indicators of possible determinants of crime are correlated with levels and trends of both common and non-common crime across the world.
A Short History of Cross-National Studies on Crime
Studying cross-national variation in common crime has a long history. Throughout the nineteenth century criminologists have studied geographical variations in rates of recorded crime. A dominant theme in this early literature was the association of crime with poverty, urbanization and social disorganization. The traditional source of information on levels and trends of common crime were court statistics on convictions for criminal offences. In the twentieth century these court statistics were supplemented by statistics of crimes recorded by the police. Such statistics were later internationally collected by organisations like the United Nations and Interpol. However, comparing common crime recorded by police forces or courts cross-nationally is problematic, since countries, police forces and courts apply different legal definitions, work procedures and counting rules. Due also to varying readiness of citizens to report incidents of crime to the police and rates of detection, the proportions of crimes that remain hidden from the official records (the so-called dark numbers of crime) vary greatly across countries. Consequently, available information on crime recorded by the police or other criminal justice actors is known to be non-comparable across countries as a measure of crime.
To overcome the problems of internationally non-comparable court and police data on common crime, criminologists since the 1980s moved their international comparative research into two new directions: (a) analysing data on non-common crime, e.g. homicide, corruption and organised crime and/or (b) analysing data from national and international crime victimization surveys.
Cross-National Studies on Non-Common Crime
Using a purpose-built database focussing on homicide rates, Archer and Gartner (1984) gave new impetus to the field of cross-national criminological research. The general idea was that homicide is the type of crime that has the least cross-national differences in legal definitions and procedures, and that almost all incidents come to the attention of criminal justice systems and/or forensic doctors, in all countries. In the 1990s international homicide data became systematically available from the UNODC’s Global Study on Homicide and from the World Health Organization (WHO). These data today cover almost all countries in the world (UNODC 2019). When international homicide data became more readily available, a new wave of epidemiological studies using national data followed (Koeppel et al. 2015).
In addition, political scientists, economists and criminologists started to analyse other types of non-common crime. In particular, more recently, cross-national analyses have sought to understand determinants of global variation in measures of corruption and organised crime (see for review on corruption: Wysmulek 2019). This became possible, since several organisations (e.g. the World Economic Forum (WEF) and Transparency International (TI)) started to carry out surveys among business executives and/or households from many nations on experiences with corruption and organized crime (WEF 2019; TI 2019). So, for non-common crimes (homicide, corruption and organised crime) a growing variety of up-to-date, cross-nationally comparative data are available for a large number of countries around the world.
Crime Victimization Surveys
In order to circumvent the many uncertainties concerning crimes recorded by criminal justice actors as measures of crime, the USA and some European nations launched, in the 1970s, crime victimization surveys among households focussing on rates of victimization by offences as defined in the domestic criminal codes (Biderman and Reiss 1967). The results of these surveys provide an alternative, and in many respects more comprehensive, source of information about crime to those recorded by the police. However, national crime victimization surveys have different designs, data collection procedures and questionnaires in the different countries, thereby limiting the comparability of their results.
To overcome these problems, the International Crime Victim Survey (ICVS) was launched by criminologists with expertise in national crime surveys (Van Dijk et al. 1990; Lynch 2006). Since its initiation, surveys have been carried out once or more in altogether 85 countries (Van Kesteren et al. 2013). Over 350,000 citizens across the world have to date been interviewed with the same questionnaire, translated in at least thirty languages. For almost three decades these data have been the only source available on self-reported data on common crime covering multiple countries in several world regions. However, it must be recognized that the ICVS covers only about a third of all countries/territories in the world (and especially lacks data from Africa), most countries were only surveyed once or twice, and new surveys since 2010 have been few and far between.
Fortunately, the Gallup World Poll (GWP) with its much wider coverage and greater periodicity, contains questions on experiences with common crimes which can be harnessed for comparative international analysis.
Theoretical Perspectives on Cross-Country and Over-Time Variations in Crime
Throughout the nineteenth century statisticians and social scientists have studied geographical variations in rates of recorded crime. Pioneers such as Guerry (1802–1866), Quetelet (1796–1874), and Von Mayr (1841–1925) started comparative studies investigating and explaining differences in crime across European geographical areas. Later in the nineteenth century, Durkheim (1897) examined how socio-economic circumstances and changes impacted on European countries’ suicide and homicide levels. A dominant theme in this early ‘cartographic’ literature was the association of crime with, inter alia, poverty, urbanization and social disorganization (for an overview see Bonger 1916). Ecological research resurfaced in the beginning of the twentieth century, when scholars described the distribution of crime and delinquency, including homicide, across neighbourhoods and identified structural factors determining levels of crime (see e.g. Park and Burgess 1925; Shaw and McKay 1942).
Current empirical criminological studies explaining cross-national and over-time within country variation in crime rates show a broad range of different theoretical approaches. Three sets of factors emerge as the common ground of contemporary epidemiological studies seeking to explain variation in crime. The first set consists of motivational determinants, like poverty, unemployment, inequality and proportions of young people. A second set comprises opportunity-related factors like urbanization, community cohesion and wealth. And an emerging third set of determinants centres around the functioning of state and democratic institutions (governance).
Motivational Factors
Many scholars have theorized that countries’ crime levels are related to factors motivating persons to commit crime. Durkheim (2005 < 1897 >) already hypothesized that rapid social change creates normlessness or ‘anomie’ leading people to engage in deviant behaviour. In the same vein Merton’s strain/anomie theory argued that individuals facing economic hardship and blocked opportunities may experience feelings of injustice and resentment pressuring them to commit crime (Merton 1938).
Reviews of more recent empirical studies aiming to explain cross-national differences in crime confirm the importance of factors related to motivations to offend. In cross-national studies, poverty, economic inequality and, to a lesser extent, unemployment were found to be strongly correlated with homicide rates (LaFree 1999; Nivette 2011; Pare and Felson 2014; Lappi-Seppälä and Lehti 2014; Koeppel et al. 2015; UNODC 2019). Furthermore, analyses of ICVS data confirm moderately strong correlations between inequality and levels of victimization by various types of common crime (Nieuwbeerta 2002; Van Wilsem 2004; Van Dijk 2008). Structural correlations were also found between the percentage of young people in populations and levels of both common crime and homicides (Van Dijk 2008; LaFree and Tseloni 2006; McCall et al. 2013). In line with this finding, the existence of a ‘youth bulge’ has been linked to various forms of civil unrest, especially in the Global South (Urdal 2006).
Opportunity-Related Factors
A second set of determinants of crime prominent in current epidemiological studies are opportunity-related factors like urbanization, community cohesion and wealth. Several criminological theorists emphasised the role of criminal opportunities. For example, according to ‘routine activity theory’, crimes are more likely to occur at places where there are (1) more motivated offenders, (2) more suitable targets, and (3) fewer capable guardians (Cohen and Felson 1979). In this perspective, higher wealth increases the availability of easily ‘stealabe’ consumer goods and—especially in large urban settings—breeds social anonymity and weak social guardianship. This theoretical perspective also emphasised the role of the availability of alcohol, drugs and firearms to foster and facilitate crime. Criminal opportunity theory has also been used to explain the prevalence of various types of organised crime (Bullock et al. 2010).
Over the past decades, a large number of empirical studies have confirmed the epidemiological importance of factors related to criminal opportunities. Victimization surveys have shown that levels of common crime across the Western world went up in tandem with the availability of suitable targets, such as (poorly secured) motor vehicles (Van Dijk 2008; Farrell et al. 2014), and that a higher degree of urbanization and lower social cohesion are related to higher levels of common crime (Lee 2000; Van Wilsem 2004; Van Dijk 2008; Corcoran and Stark 2020).
Governance
A distinct third set of factors emerging in the literature explaining variation in countries’ levels of crime centres around the functioning of state and democratic institutions. Historically, the role of a (good functioning) state to prevent criminal and violent behavior was argued by the seventeenth century philosopher Thomas Hobbes. Furthermore, the importance of the role of the (emergence of) a nation-state for reducing crime is theorised in historical studies on homicide (Eisner 2014). In addition, political scientists and economists—especially from the New Institutionalist School—have increasingly pointed to the nefarious linkages between bad governance, corruption, violence and underdevelopment (Acemoglu and Robinson 2012; Wenmann and Muggah 2010; World Bank 2011; UNDP 2013; Acemoglu et al. 2017). From this perspective, poorer nations are caught in traps of weak state institutions, underdevelopment and high levels of crime and corruption (Kaufmann and Kraay 2002; Kaufmann et al. 2009).
The importance of the role of countries’ levels of ‘governance’ for their levels of violence and crime is also shown in several empirical studies of current crime levels. Van Dijk demonstrated how dysfunctional governance, organised crime and underdevelopment are intercorrelated at the country level (Van Dijk 2007, 2008). In cross-national studies on homicide, various indicators of ‘poor governance’, rule of law or legitimacy emerged as key independent determinants of homicide rates (LaFree and Tseloni 2006; Nivette and Eisner 2013; Chu and Tusalem 2013; Lappi-Seppälä and Lehti 2014; Karstedt 2015; Stamatel 2016; Huebert and Brown 2019). Furthermore, bad governance was found to be one of the main dimensions of the Vulnerability Index for human trafficking/modern slavery grounded in GWP data (Joudo Larsen and Durgana 2017).
Data, Measures, and Indices
Gallup World Poll Data
Two out of the broad range of Gallup World Poll’s many items relate to experiences with theft and violent crime respectively. We use these data from all Gallup World Poll surveys held in the 14-year period 2006–2019. The surveys are conducted in over 160 countries worldwide, making up more than 98% of the world’s adult population. The target population is the entire civilian, non-institutionalized adult (aged 15 + or 18 + years) population. The coverage area is the entire country including rural areas, and the sampling frame represents the entire country. The survey is translated into the primary languages of the countries and is then given to approximately 1000 individuals. The survey is conducted annually in most countries, but in some it is conducted once every two or three years—and in a few countries only every five or six years. The survey is conducted over the telephone in countries where at least 80% of the population has telephones by means of either random-digit dialling or a nationally representative list of phone numbers. Face-to-face interviewing is used in the other countries. More detailed information regarding the GWP’s methodology can be found at the website of the Gallup organisation (www.gallup.com).
To make the data optimally nationally representative and cross-nationally comparable, we apply the data weights as provided by the GWP. These weights account for oversamples, household size, national demographics (i.e. gender, age, and—where available—education or socioeconomic status), nonresponse, unequal selection probability, and design effects. In addition, we exclude all respondents under 18 years of age to ensure consistent age thresholds across countries.Footnote 1
Gallup Sample of Countries
Our sample of countries comprises all countries for which data on victimization of theft and assault are available in the Gallup World Poll over the years 2006–2019. This set of countries includes a total of 166 countries out of the 190 countries recognised by the United Nations during that period. Missing countries are all relatively small with the exception of North Korea. According to the geographical classification of the United Nations, the sample encompasses 40 countries from Europe, 2 from North-America, 26 from Latin America and the Caribbean, 49 from Africa, 47 from Asia and 2 from Oceania. Especially notable is the inclusion of 49 countries from Africa, a region conspicuously underrepresented in other datasets on crime, comprising of 17 countries from Eastern Africa, 7 from Middle Africa, 6 from Northern Africa, 5 from Southern Africa, and 14 from Western Africa (see Table 1).
Since in many years over the 14-year-period 2006–2019 questions on common crime are included in the GWP-questionnaire and Gallup interviews approximately 1000 residents per country annually, we have data on crime from 1780 so-called ‘country/years’. Since most countries are, as said, surveyed in multiple years, our measures for common crime are based on almost 1.8 million interviews, i.e. on average 10.6 thousand interviews per country (see Table 1).
Measures
Common Crime Measures
In our study we focus on two questions in the GWP-questionnaire pertaining to the actual experience of victimization by common crimes, i.e., whether a victim of theft (“Within the past 12 months, have you had money or property stolen from you or another household member?”) and whether a victim of violence, i.e., assault or mugging (“Within the past 12 months have you been assaulted or mugged?”). We constructed three measures on victimization of common crime based on these two questions. First, we used the yearly prevalence rate of persons who indicated they were a victim of theft—and calculated the average theft rate (in %) in each year in the 166 countries from which these data were available (N = 1780 country/years). Second, we did a similar exercise using the data on victimization of violent crime to calculate the violence (assault/mugging) rate (in %) in the 165 countries and all years/years for which these data are available (N = 1315). Third, we used both GWP-questions together and calculated the rate of persons who were victim of theft and/or violence in all years and all 165 countries from which both questions are available (N = 1302).Footnote 2
Next, we cross-validated the resulting national prevalence rates from Gallup World Poll with estimates of similar types of crime from the last rounds of the International Crime Victim Survey (ICVS) (Van Dijk 2008). These last rounds of the ICVS, conducted between 1996 and 2010, cover many Western countries, i.e. Europe, North America, Australia, and New Zealand, several countries in Asia and Latin America and—in a more limited number—Africa. The comparison could be made for the 69 countries participating in both types of survey. Considering the many differences between the ICVS and GWP methodologies, including in formulation of questions on crime experiences, and in periods of data gathering (1996–2010 and 2006–2019 respectively) near perfect correlations between the ICVS and GWP victimization prevalence rates were not to be expected. Correlations were found to be moderately strong. For example, the Pearson correlations between the GWP and ICVS-based rates for various types of theft are 0.63 (N = 69) and for assault/muggings 0.67 (N = 68) respectively. Furthermore, the Pearson correlations between our combined GWP-based measure for theft and/or violence and the ICVS’s overall crime rate, covering all ten different types of crime used, is 0.62 (N = 69). The latter correlation suggests that the Gallup World Poll’s two broadly defined and partly overlapping items on theft and assault/muggings capture the volume of common crime in a country surprisingly well.
Homicide
To monitor progress towards achieving crime-related Sustainable Development Goals the United Nations recommends the use of homicide statistics besides survey-based data on violence (UNODC 2019). The WHO collects data on homicide from public health sources through a dataset on the causes of mortality. The UNODC collects data primarily from criminal justice sources, although for some countries the UNODC relies on public health data. Where both criminal justice and public health sources exist, the two sources often provide similar results (Andersson and Kazemian 2018). In our sample the Pearson correlation between the average UNODC and WHO measures for the period 2006–2017 was 0.81 (N = 97 countries). We choose to use the more comprehensive UNODC dataset (UNODC 2019), available for 135 of the GWP-countries over the period 2006–2017 (see also Table 2).
Organised Crime
Organised crime is defined in the UN Convention on Transnational Organised Crime as the commission of ‘serious crimes by a structured group of three or more persons for material gain’. This definition has been specified by listing secondary characteristics such as high-level corruption, money-laundering, infiltration in the legal economy, and instrumental violence (Fijnaut and Paoli 2004). An item in the survey of the World Economic Forum (WEF) asks business executives, “In your country, to what extent does organized crime (mafia-oriented racketeering, extortion) impose costs on businesses?’ (Schwab 2015). This item captures infiltration into the legal economy through the perspectives of business executives. Answers to this question are strongly correlated to measures of corruption and of money-laundering and moderately to a proxy measure of mob-related violence consisting of country rates of unsolved homicides (Van Dijk 2007). For Africa, a new comprehensive index of organised crime harnessing experts’ assessments of the presence of various sorts of criminal markets and criminal actors in their country has been designed. This index was found to be strongly correlated to the WEF item on ‘costs on businesses’ (ENACT 2019).
To measure the extent of organised crime and related corruption, we combined measures from three widely available sources. The first measure is the item in the WEF survey just mentioned. The second measure is the Corruption Perceptions Index (CPI) of Transparency International (Transparency International 2015) which aggregates information from business people and country experts on the level of corruption. The third measure is an item in the GWP, which asks private respondents “Is corruption in government widespread?” The three measures are highly intercorrelated.Footnote 3 To construct an Organised Crime Index, the three measures were averaged, then standardised (with a mean of 0 and standard deviation of 1), and normalisedFootnote 4—so that they each range from 00 to 100 (with higher scores meaning more organised crime and corruption). We constructed this index by averaging the three normalised scores. Scores on this index could be calculated for 163 countries.
Determinants of Crime
In our review of studies on the possible determinants of crime (see above) we distinguish three main theoretical perspectives, respectively those focussing on motivations to offend, on opportunities of crime, and on the efficacy of state institutions (governance). To construct measures of the key determinants falling under these three headings, we selected indicators for which reliable data wasavailable for more than 150 of the 166 GWP countries and—to be able to study correlates of trends—for each of these countries for (almost) every year in the period 2006–2019.Footnote 5 The indicators encompassed three separate indicators of offender-related determinants (Poverty, Inequality, and % Youth), two indicators of opportunity-related determinants (Wealth and Urbanization) and one for Governance, which includes, inter alia, indicators of governance and the rule of law (See Table 2 for details).
Analytic Strategy
The first aim of our analyses is to describe the geographical distribution across global regions, sub-regions and countries in people’s experiences with crime in countries for the period 2006–2019. To do this, we use data for the entire 14-year period, but in order to take possible changes over time into account, also for the periods 2006–2009, 2010–2014, and 2015–2019 separately (see Table 3). Note that when calculating crime figures for (sub-) regions we first average on the data in each country, and then calculate the average over the countries in a (sub-)region.Footnote 6
The second aim is to describe developments in common crime between 2006 and 2019 in each of the 139 countries in the world for which we have sufficient Gallup World Poll (GWP) data available to adequately examine trends.Footnote 7 Since not for all countries survey data for all years are available, and we are interested in overall long terms trends, and not in yearly or short term fluctuations, we decided to use predicted values from OLS-linear regression models that were estimated for each country individually based on real values from available years. In these models, the dependent variable is the prevalence of crime (in %) in that country, and the independent variable is the calendar year. These models thus generate predicted levels of crime assuming a linear trend in each country.Footnote 8 We calculated the differences between the predicted levels of crime in the last year (i.e. 2019) and the first year (i.e. 2006) in each country as measure for the size of ‘linear change’. In other words: the trends are presented as “percentage point” i.e. the simple numerical difference between the predicted percentage in 2019 minus the predicted percentage in 2006 (see Tables 4 and 5). When presenting ‘linear change’ per (sub-)region (see also Tables 4 and 5), the measures of the countries in these (sub-)regions are averaged.Footnote 9
The third aim of the analyses in this paper is to explore whether and to what extent the patterns of cross-national and over-time variation in relevant country characteristics are related to levels and trends in countries’ levels of common and non-common crime. In these analyses we take three steps. As a first step we examine bi-variate correlations between (changes in) country characteristics and levels of and trends in common and non-common crime (see Table 7). Second, since many of the chosen possible determinants are highly correlated to each other, we have next run multi-variate ordinary least square (OLS) regression models in which the independent effects of (trends in) country characteristics are examined while controlling for the effects of (trends in) the other characteristics. OLS-regression models are run to explore effects of country characteristics on countries levels of crime (see Table 8), and separate models are run to explore effects of trends in country characteristics on trends in countries’ levels of crime (see Table 9).
As a third step of our analyses of the relationships between determinants of crime and (trends in) levels of crime, multi-level models were conducted wherein cross-sectional and trend analyses are done simultaneously. This strategy has the advantage that the full multi-country and multi-year dataset can be used in one model (for Theft there are a total of 1780 country/year observations, for Violence 1315 and for Theft and/or Violence 1302). These models have the additional advantage that when estimating the coefficients, separate residual components can be specified at the country- and year-level, and adjustments can be made for the correlation of the error components of the two levels. Since the results of the multi-level models fully correspond with the results of the separate cross-sectional and over-time OLS-regression analyses—and the latter analyses are more easily understandable—we focus on the OLS-regression results in the main text of the paper and present results of the multi-level models in “Appendix B”.
Describing Worldwide Patterns and Trends of Crime
Regional and Sub-Regional Variation in Common Crime
In this section we look at the distribution of victimisation rates for two separate types of common crime (theft and violence (assault/muggings)) and for the combined victimisation rate of theft and/or violence over six world regions and twenty-one sub-regions, including four individual nations (Canada, USA, Australia, and New Zealand). Table 3 summarizes the results for the world regions and sub-regions. It does this for the entire 14-year period 2006–2019, and, to check for consistency, for the periods 2006–2009, 2010–2014, and 2015–2019 separately.
Levels of common crime, expressed in one-year victimization percentages for theft and assault/muggings—and their combination—appear to vary substantially and consistently across regions and sub-regions around the world. Furthermore, the geographical distribution of levels of crime is largely uniform across theft and assault/muggings.Footnote 10 Generally, African and Latin American, including Caribbean countries appear to suffer most from these types of common crime across our measures. Africa ranks first for theft and violence. Especially Sub-Saharan Africa shows very high levels of both types of crime. Levels in North Africa are close to the global mean. Latin America ranks second for both theft and violence. Sub-regional variation is limited here. Asia, Europe, North America and Oceania (Australia and New Zealand) experience medium to high levels of both types of common crime with New Zealand experiencing the highest level of theft.
Two results stand out in the light of prior comparative research. First, the very high level of common crime across Sub-Saharan Africa. Prior research using ICVS data already indicated that populations in Sub- Saharan Africa experienced relatively high common crime rates—but that finding related to a much more limited number of countries and to an older period (mainly 1996–2000). Moreover, prior studies of GWP data (Corcoran and Stark 2018, 2020) showed that levels of violent crime (i.e. of assault/muggings) were the highest in Sub-Saharan countries, but did not present data on levels of property crime. On average around a quarter of the population in Sub-Saharan Africa reported having their money or property stolen from them or another household member in the course of last year, and more than ten percent reported that they had been assaulted and/or mugged.
Second, the very high victimisation rates of property crimes in Latin America and the Caribbean stand out too. Prior research typically highlighted the high violence rates in Latin America (Corcoran and Stark 2018, 2020). The current result shows that Latin American countries in an international perspective also experience very high victimisation rates for theft. A fifth of the populations in these countries reported having their money or property stolen from them or another household member in the past year. This too had already emerged from analyses of the ICVS datasets, but only for a smaller number of countries and for a less recent period (Van Dijk 2008).
Global Trends in Common Crime
Next, we look at the trends in victimisation rates of theft and violence (assault/muggings), and of the combined victimisation rate of theft and/or violence over six world regions and twenty-one sub-regions. Table 4 summarizes the results of the trend analyses, and presents average linear trend estimates (in percentage points) for all countries per world-region and sub-region.Footnote 11 As explained in the analytical strategy section above, these trend estimates represent the numerical difference between the predicted percentage in 2019 minus the predicted percentage in 2006. For example, the value of -4.1 of the trend estimate for Oceania for common crime (theft and/or violence) represents a decrease in estimated victimisation rates from 19.6 percent in the year 2006 to 15.5 percent in the year 2019—and thus a change of 19.6–15.5% = − 4.1 percent points (%p.).Footnote 12
The trend analysis of common crime around the world over the past fourteen years—as summarized in Table 4—confirms prior studies showing that levels of common crime have, possibly due to improved security, been declining in Europe, Australia and New Zealand since the turn of the century (Van Dijk et al. 2012; Farrell et al. 2014). Our data show that since 2006 common crime has declined across Asia, except in Southern Asia, and across Latin America as well. Somewhat surprisingly, the GWP-data did not show a continuation of the much discussed ‘crime decline’ in the USA since 1995 (Zimring 2006). Estimated levels of theft and violence in the USA are roughly the same in 2019 as they were in 2006. The crime drop in the USA has set in some years earlier than elsewhere (Van Dijk 2008), and seems to have bottomed out sooner too.Footnote 13
Africa emerges as the only world region where crime has gone up since 2006 (with on average 11.6 percentage points). In 27 of the 35 African countries included in the trend analysis, levels of crime increased substantially over the period 2006–2019, i.e. more than five percentage points. Rises are most pronounced in Sub-Saharan countries.
To further examine the geographical distribution of trends in common crime we looked at the correlations between countries’ trends for theft, violent crime (assault/muggings) and common crime. The correlation between countries trends in national theft rates and rates of violence appeared to be moderate (r. = 47; n = 136).Footnote 14 When a country experiences an increase in levels of property crime it is somewhat more likely to experience an increase in levels of violent crime as well, and vice versa, but this is far from assured.
By way of summing up, Fig. 1 presents an overview of our findings on the distribution of both levels and trends in common crime across world regions, sub-regions and countries. It reveals at a glance the uniquely diverging position of Africa as the world region wherein most countries have experienced both the highest average prevalence during 2006–2019 and the most pronounced increases during this period. Latin America stands out as the world region with the second highest average prevalence but with a declining trend in most countries. In Asia prevalence is highest in South Asia. This is also the only Asian sub-region where the rate has in most countries gone up. Elsewhere in the world prevalence was relatively low during 2006–2019 and has declined or remained stable.
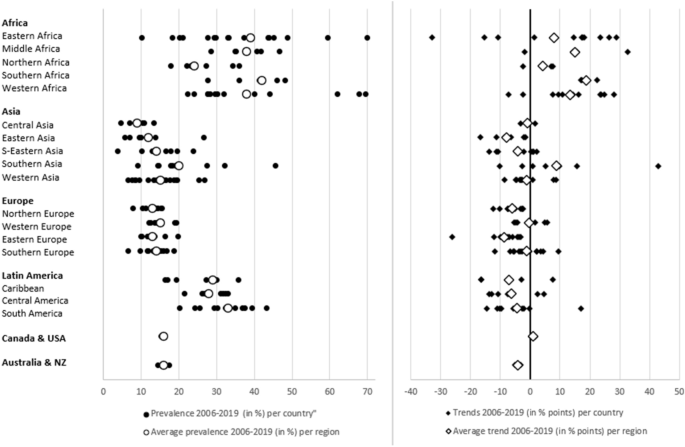
Prevalence and trends in common crime, 2006–2019 (Per country and region)
Regional and National Variation and Trends in Non-Common Crime
As discussed, criminologists in the 1980s switched their attention to the collection and analysis of international data on non-common crime, e.g. homicide, and corruption/organised crime. Now that data on common crime have also become more widely available, it is interesting to see to what extent levels and trends in common crimes are correlated to levels and trends in these non-common crimes. First, we will present the results on variations in homicides and organised crime.
Table 5 shows homicide rates calculated per 100,000 inhabitants based on the UNODC World Reports on Homicide from 2006 to 2017 for 142 countries. The world average rate per 100,000 is 8. Latin America is in a league of its own with an elevated rate of 23, with Central America leading with an average rate of 32. Africa comes in second place with a much lower regional rate of 8. This average is lifted upward by the exceptionally high rate of Southern Africa (24). In most other African regions rates of homicide lie far below the global mean. Rates of other world regions vary within a narrow range of 1 to 3. In Asia Central Asia stands out with a relatively high rate of 5. The lowest rates are found in Western Europe and in Oceania (Australia/New Zealand). Within the Western world, the USA shows a conspicuously high rate of 5.
Trend analysis of homicides (see also Table 5) could be adequately done for 121 countries worldwide. It shows a uniform modest decline across all world regions.Footnote 15 The only noticeable exception is Central America where the homicide rates went up by 1,5 points (i.e. per 100.000 inhabitants) (see also Alvazzi del Frate and Mugellini 2012).
Table 5 also shows the regional average scores on our composite Organised Crime/Corruption Index, which, as explained, includes business executives’ perceptions of mafia-type practices and two items on corruption in government, between 2007 and 2017. The findings display that the highest rates for exposure to organised crime/corruption are, once again, found in Africa and Latin America (both 68 on the 0–100 scale used), followed by Asia. Lowest rates are found in Western and Northern Europe and in Oceania. Within Europe, the levels are comparatively high in Eastern and Southern Europe (scores of 64 and 60 respectively). The level is relatively high in the USA too (49), especially when compared to that of Canada (27).
The trend data on organised crime show a small global increase with considerable regional variation. According to the index organised crime has gone up in North America (plus 6 percentage points), Australia (plus 9) and Latin America (plus 3). In Europe organised crime went down somewhat in Eastern Europe but up everywhere else. Trends were also divergent in Asia. Finally, organised crime went on average down in Africa with Northern Africa, where the level went up with 11 percentage points, being a clear-cut exception.
Intercorrelations of Common and Non-Common Crime
We have earlier reported on the strong cross-sectional associations between national rates for three types of common crime (r = 0.85 or more). Our analyses showed that rates of homicide and organised crime are moderately correlated with each other (r = 0.41; N = 136). Some degree of correlation was to be expected since, as discussed, instrumental violence is seen as one of the defining characteristics of organised crime.
To examine the geographical association of common and non-common crime, we calculated the Pearson correlations between the country rates for theft, violence (assault/muggings), and their combination (theft and/or violence), and our measures for homicide and organised crime (See Table 6).
As can be seen in Table 6 rates of common crime show weak to moderate correlations with rates of non-common crime. Correlation coefficients between our measure for common crime (theft and/or violence) and homicide and organised crime are 0.34 and 0.45 respectively. So, if certain countries experience high levels of theft and/or violence, they are only somewhat more likely to be exposed to high levels of homicide and/or organised crime too. Although the correlations are only moderately strong, it seems worth noting that countries in Africa and Latin-America rank highest for all types of common and non-common crime alike.
Next, we looked at the correlations between trends in common and non-common crime. Different from the correlations between levels of common crime, those between estimated linear change measures of common crime and non-common crime are non-existent or very weak. There is, for example, only a very low correlation between trends in common crime and those in homicide rates (r. = 0.18). Our trend data on common and non-common crime thus suggest that common and non-common types of crime show considerable divergence in their movements over time.
By and large, our epidemiological crime data show that countries’ levels of different types of common crime show roughly similar geographical distributions and trajectories over time but that this does not, or to a much lesser degree, hold for types of non-common crime. Homicides and organised crime show geographical patterns and trajectories distinctly different from those of common crime. This finding suggests that determinants of crime at the macro level may be different for common than for non-common types of crime. Whether this supposition is valid, we will explore in the next section.
Testing Explanations for Worldwide Patterns and Trends of Crime
Determinants of Cross-National Variation in Crime
As a first step in our explorative analysis of possible determinants of various types of crime, we examine bi-variate correlations between country characteristics (averaged over the period 2006–2019) and levels of common and non-common crime (also averaged over 2006–2019) (see Table 7). As can be seen in this table, all six determinants are significantly correlated with most or all five measures of crime with homicide as exception (with rates being uncorrelated to poverty and urbanization).
Two sets of indicators are correlated with crime in the expected direction. First, the motivational determinants, Poverty, Inequality, and Youth present an unambiguous picture. In line with offender-related hypotheses, poorer, more unequal, and younger populations experience higher levels of all five types of crime, except homicide. Second, our composite index of governance appears to be inversely related to all five types of crime, most strongly so with organised crime (r = − 0.73). However, contrary to expectation, the correlations between the two opportunity-related determinants and all five types of crime are reversed, suggesting that levels of crime are significantly lower in more urbanized, affluent societies.
Since many of the chosen independents including poverty and wealth are highly correlated to each other, a multi-variate analysis is obviously called for to examine the independent relationships with crime.
As a next step in our explorative analysis of possible determinants of various types of crime, we have run multi-variate OLS-regression models in which the independent effects of country characteristics are examined while controlling for the effects of the others. Such analyses are not unproblematic, since several of our country characteristics are so strongly inter-correlated that problems of multi-collinearity arise when running ordinary regression models. In particular, our index of governance is very strongly inter-correlated with our set of independents representing offender-related factors (Poverty, Inequality and Proportion), and, though to a lesser degree, with opportunity-related factors (Wealth and Urbanisation) as well. As a remedy, we have introduced dummy variables in our regression models representing three groups of countries: failed states (with governance scores < 1.5, N = 26), frail states (governance 1.5–8.5, N = 96), and effective states (governance > 8.5, N = 36) (as reference group) respectively—and centred the values of the other independent variables around their means of each of these groups separately. In this way we have analysed the correlations of crime with the variance in the other independents among countries with similar degrees of governance (a fixed effects model).Footnote 16
Doing this not only overcomes the ‘technical’ multi-collinearity problem. It also follows the theoretical ideas emerging from the New Institutionalist School in economics about the close linkage between bad governance and underdevelopment (Acemoglu and Robinson 2012). Good governance of states is regarded as the principal driver of sustainable development—e.g. less poverty and inequality. As can be seen in “Appendix A”, our dataset supports this theoretical notion. The results of the regression analyses are presented in Table 8.
The results, first of all, show clear and consistent inverse relationships between the countries’ level of (good) governance, and the measures of all five types of crime. The estimated parameters for each of the two country groups represent the average crime rates of the ‘failed states’ and ‘frail states’ compared to the ‘effective states’. The results show that failed and frail states suffer from significantly more crime problems overall than more effective states. The importance of good governance is most pronounced for organised crime. These results fully confirm the institutionalist perspective: bad governance is linked not only to underdevelopment but to various forms of insecurity as well.
The second main finding is that the motivational, offender-focussed factors of poverty, inequality, and proportion of youth are important predictors of common crime, even after controlling for the effects of different levels of governance. Apparently, classical criminological notions about poverty-related, motivational causes of common crime have at the global scale lost none of their pertinence.
Third, in the multi-variate analysis the urbanization indicator is positively related to common crime, as predicted by criminal opportunity theory: anonymous urban environments breed more crimes by ‘opportunistic’ offenders (Felson and Cohen 1980). However, contrary to expectations, wealth is not positively related to theft or violent crime. The absence of a significant relationship between wealth and crime is probably due to the dual and opposing impact of wealth on common crime. While affluence brings a larger supply of suitable targets, its criminogenic impact, predicted by opportunity theory, may be offset by lower numbers of motivated offenders. In addition, above average investments in security measures in more affluent societies may have reduced their vulnerability for opportunistic property crimes (Van Dijk 2008; Farrell et al. 2014).
Finally, for non-common crime the results are less clear in several respects. A country’s percentage of youth in the population is a predictor of homicide, as suggested by the literature. And a nation’s level of inequality is associated with organised crime. However, poverty, wealth and urbanization are not associated with either homicide or organized crime. The latter findings hint at the complex, still poorly understood interrelationships between governance, organised crime and wealth (ENACT 2019).
Determinants of National Trends in Crime
The availability of trend data on the five types of crime for the period 2006–2019 allows an explorative test of the relevance of the determinants of crime for explaining changes over time in levels of common and non-common crime. Possibilities for such test are of course conditional on the availability of trend data of the independents as well. For this paper we use the time series data available on all six indicators included in the cross-national analyses (see Table 2).
Using these data, we generated predicted values for each indicator from OLS-linear regression models that were estimated for each country individually based on real values from available years (similar to what we did to obtain trend estimates for crime). Next, we calculated the differences between the predicted scores in the last year (i.e. 2019) and the first year (i.e. 2006) in each country as measure for the size of ‘linear change’. Subsequently, we examine the extent to which these linear trends in country characteristics are related to linear trends in crime. Again, as in the cross-sectional analyses, bivariate analyses (not shown here) were followed by OLS-regression analyses (see Table 9).Footnote 17
The results show that global variation in trends in crime cannot be explained as adequately by the determinants included in the analyses as cross-national variation. The explained variance of trends in crime is much smaller (i.e. less than 31% for violence and homicide, and around 50% for the other types of crime) than of cross-sectional variation (47% for homicide and 72% or more for the other crime types). Furthermore, several of the estimated multivariate correlates are statistically insignificant.
In line with the findings of the cross-sectional analyses presented above, positive correlations were found between changes in percentage youth and trends in theft, violence and in these crimes combined. In countries with increasing proportions of (marginalised) young various types of crime have gone up.
Contrary to our cross-sectional finding that poverty is associated with more common crime, negative correlations were found between changes in poverty and changes in common crimes, especially thefts. This could either mean that countries with increasing poverty are experiencing less common crime, or that countries with decreasing poverty experience more crime. Since changes in our measure of wealth are not significantly correlated with changes in levels of common crime, the finding that less poverty goes together with more thefts calls for further scrutiny.
Finally, trends in governance-related factors appear to be associated with our measure of organised crime/corruption but not with other types of crime. Trends in our index of organised crime were found to be inversely correlated with changes in the quality of Governance/Rule of Law and Wealth (GDP). In line with the institutionalist perspective, the increases in organised crime/corruption in some parts of the world seem to have gone together with deteriorations in the functioning of state institutions, less economic growth, and more poverty.
Discussion and Limitations
In recent years polling companies have started to supply survey-based datasets on levels of various types of common and non-common crime across the world. Cross-validation with results from in-depth criminological studies such as the ICVS has shown encouraging results in this study. Country prevalence of common criminality can apparently be reasonably well estimated with just two catch-all items on theft and assault/muggings in national sample surveys. Credible data on (recorded) homicides and perceptions of organised crime and corruption have also become available.
The datasets used on prevalence of thefts, assaults/muggings, common crime overall, (recorded) homicides, and organised crime/corruption, covering 166 countries worldwide, shows huge variation across regions and sub-regions. By far the highest levels of common crime are experienced by populations in the Global South, most notably in Africa—especially sub-Saharan Africa- and Latin America. Levels of homicide are highest in Latin America, particularly in Central America and the Caribbean, followed by Southern Africa. Organised crime shows, once again, the highest concentrations across Africa and Latin America, and in Asia. Within the Western world, Eastern and Southern Europe and the USA stand out with comparatively high scores on organised crime/corruption.
By and large, the geographical distribution reveals the existence of a deep North–South Security Divide in the beginning of the twenty-first century. Over the past fifteen years this gap has widened by the continued rise in levels of common crime in Africa and South Asia and of homicides in Central America while almost everywhere else these forms of crime have dropped. Trends in organised crime, including grand corruption, show a somewhat different picture with decreases in sub-Saharan Africa, and increases in Latin and North America, Australia and parts of Europe.
Differences in the geographical distribution of different types of crime and divergent trends in these types of crime between 2006 and 2019 shed doubt on general theories about the macro-causes of crime. This is confirmed by our explorative analyses of relationships between determinants of crime and levels of various types of crime. Traditional ideas about ‘root causes of crime’ such as poverty and inequality emerged strongly in regression analyses of levels of common crime but less so in those of homicides and organised crime. Apart from these common causes of crime, levels of common crime seem to be co-determined by the availability of easy targets of theft and reduced social control in urban environments. Urbanization, however, is totally unrelated to levels of homicides or organised crime.
Our explorative analyses furthermore point at the pervasive impact of governance-related factors on crime levels: prevalence of all types of crime is significantly higher to the extent that state and democratic institutions are weaker. This appears to be true not only, as was to be expected from previous studies, for homicide (La Free and Tseloni 2006; Chu and Tusalem 2013; Karstedt 2015) and organised crime (Van Dijk 2007; ENACT 2019), but, to some extent, for common crime as well.
A subsequent analysis of the correlates of trends over time of common crime confirmed the role of governance-related factors in explaining variation across countries in the movement of various types of crime. Besides, changes in common crime over the past fifteen years were strongly related to ongoing urbanization, increased proportions of young and growing inequalities. The exceptional, and pronounced increases in common crime in Sub-Saharan countries, discussed above, are likely to have been driven by expanding ‘youth bulges’ across the region.
The findings concerning governance conform to, and elaborate on the New Institutionalist School in comparative economics. The institutional capacity of countries seems to be the principal driver not just of sustainable development but of internal security as well. Between economic stagnation and organised crime appear to exist nefarious, mutually reinforcing relationships (Acemoglu et al. 2017). Linkages between governance, development and common crime, partly mediated by governance-related factors as (extreme) poverty, inequality, and high proportions of (marginalised) youth, are close as well. Many poorer nations seem in the grip of vicious circles of poorly functioning state institutions, underdevelopment, expanding youth bulges and accompanying high levels of all sorts of crime (Van Dijk 2008; Wenmann and Muggah 2010; World Bank 2011; UNDP 2013). Our results underline the importance of reducing levels of crime and violence as integral part of the United Nation’s 2030 Agenda for Sustainable Development.
Limitations
For our analyses we have used readily and widely available international measures of crime and of the main possible determinants of crime mentioned in criminological literature. This reliance on available data has introduced important limitations to our analysis. The results show that the chosen core determinants explain a considerable part of cross-sectional variance in prevalence of common crime and organised crime but less so in that of homicides. Their explanatory power for medium term trends over time proved to be limited for all types of crime. Unexplained cross-sectional and over time variance may be related to important criminogenic factors omitted in our analysis, both general and crime-specific ones. Examples of the latter are gender inequality, alcohol abuse and firearm possession as drivers of violent crime and homicides. Special cultural factors have remained altogether unexplored in our analyses. Subsequent studies should widen the choice of correlates and seek to specify relevant aspects of broadly operationalised variables as inequality, youth or ‘bad governance’.
Future international surveys or other studies will hopefully provide more refined measures of common crime, homicides, organised crime and other types of crime. These should then, ideally, be regressed against tailor-made operationalisations of possible determinants informed by current criminological theory. Such focussed cross-sectional and longitudinal analysis would bring research into the macro causes of crime to the next level. Even such improved correlational analysis would not, however, allow drawing conclusions on causality. Other types of research are required for causal inference. Correlational analysis should be complemented by studies focussing on crime trends in countries affected by major and sudden upheavals due to external forces like war, natural disasters or pandemics. A pertinent example would be an analysis of crime trends in countries where conflicts have disrupted the normal functioning of state institutions and/or the economy.
Change history
27 July 2022
A Correction to this paper has been published: https://doi.org/10.1007/s10940-022-09553-w
Notes
We also did sensitivity analyses by excluding countries in which the GWP-documentation indicated that less than 85% of the population was represented (e.g. due areas where the safety of interviewing staff is threatened, scarcely populated islands in some countries, and areas that interviewers can reach only by foot, animal, or small boat). The results of these sensitivity analyses are very similar to the analyses using all countries. We therefore do not show the results of the sensitivity analyses in this paper. Furthermore, we also test for the robustness of the results by excluding countries with fewer than 3 years of GWP data. Again, these results were very similar to the analyses on all countries (not shown in this paper).
We recognise that the measure for common crime combines a household rate for theft and a personal rate for assault/mugging. In reports on the ICVS rates for personal and household crimes are similarly combined into an overall prevalence rate for victimization experiences as individual persons and/or household member (burglaries and car thefts). In this respect the GWP-based common crime rate and the ICVS over all prevalence rate are fairly similar.
The correlations between the measures are: WEF-TI .70 (n = 139), WEF-Gallup .51 (N = 139), TI-Gallup: .54 (N = 138). The reliability index of the scale is: .81 (N = 1.496).
Standardised: with mean of 0 and standard deviation of 1, and Normalised: Normalised Value = 1 + (Value – minimum value)*(100–1)/(maximum value – minimum value).
In early stages of our explorative, cross-sectional analyses we looked at a larger selection of possible determinants including unemployment, social disorganisation (operationalized as rapid changes in wealth), alcohol consumption and possession of firearms. Unemployment and social disorganisation appeared to be unrelated to our main measures of crime. Alcohol consumption was found to be significantly related to levels of violence and homicides in multivariate analyses and so was firearm possession to homicides. Our initial operationalisation of Governance was a scale of nine indicators taken from the World Bank Governance Index, the Fragile State Index and the WEF surveys (police performance). In our final analyses we have included only one of these indicators, the FSI P1 indicator of State Legitimacy. Results concerning the role of governance of earlier multi-variate analyses using the composite scale were identical to the ones presented here.
When doing this, we gave each country the same weight—regardless of number of inhabitants of a country or the number of respondents in Gallup World Poll in each country.
We included 139 countries for which data is available from at least one year in the period 2006–2010 and one year in the period 2015–2019.
The models are as follows: Crimeij = γiDi + βiYearij + µij, with Crimeij—i.e. the level of crime in each country i and year j—being the dependent variable, Di dummies for all the countries, and Yearij the Years (from 2006 thru 2019, and βi the countries’ trend parameters. We centred the Yearij-variable around the value in the first year of the observation period, i.e. 2006.
When doing this, we gave each country the same weight—regardless of number of inhabitants of a country or the number of respondents in Gallup World Poll in each country.
The Pearson correlations between the countries’ average prevalence rates for Theft and Violence in the period 2006–2019 is 0.85, for Theft and ‘Theft and/or Violence’ 0.97 and for Violence and ‘Theft and/or Violence’ 0.95.
Note that the trends reported in Table 4 do not necessarily match with the figures reported in Table 3. For example, Table 3 seems to suggest a stable overall crime rate in Asia between 2006/10 and 2015/19, while table 4 reports a decline by 1% point (across the 14-year period). These differences result from the different ways in which the analyses were done: Table 3 presents average levels of crime victimization rates in the counties per (sub-region) for the periods, 2006/10, 2011–2014, and 2015/19, whereas Table 4 present average linear trend estimates (in percentage points) for all countries per world-region and sub-region (see Sect. 4.4. Analytical strategy). Moreover, the trend analyses presented in Table 4 are based on a more restricted number of countries, i.e., only countries for which data is available for at least one year in the period 2006/10 and one in the period 2015/19. Nevertheless, the overall pictures of Tables 3 and 4 are very similar.
Readers might wonder why no statistical significance levels are presented for the trend parameters. This is since the presented average linear change estimates per (sub-) region result from averaging estimates of country level OLS-regression analyses—and not from regression analyses per (sub-)region (see Sect. 4.4. Analytical Strategy). Moreover, we preferred to focus on whether the trends in crimes are substantive (in percentage points) rather than on statistical significance (see also Fig. 1).
Rates of violent crime in the USA have been more or less stable since 2003 according to the NCVS (Morgan and Truman/BJS, 2020). Rates for property crimes are not comparable with those of GWP.
Correlations between trends in theft and violence and trends in the composite rate for common crime were – logically – very high (r. = 90 and .80 respectively).
Similar to the trend analyses for common crimes, we used predicted values for homicide and organised crime from OLS-linear regression models that were estimated for each country individually based on real values from available years. In these models, the dependent variable is the prevalence of homicide or organised crime in that country, and the independent variable is the calendar year. These models thus generate predicted levels of these type of crimes assuming a linear trend in each country. We calculated the differences between the predicted levels of crime in the last year (i.e. 2017) and the first year (i.e. 2006 for homicide and 2007 for organised crime) in each country as measure for the size of ‘linear change’.
For all regression models, both for cross-national variation and variation in trends, the variance inflation factors (VIFs) are under 3, suggesting that multicollinearity is not a problem. We have also examined the data for potential outliers (e.g. using residuals) and rerun all models excluding the possibly influential outliers from the analyses (the pertaining (number of) countries excluded differ across types of crime – but are not more than 9). These extra analyses (results not shown) yielded very similar or identical results.
Since the correlations between the linear trends in the determinants are low or at most moderate, and there is no problem of multi-collinearity, we did not include dummies for failed and fragile states in the regression models.
References
Acemoglu D, Robinson JA (2012) Why nations fail: the origins of power, prosperity, and poverty. Crown, New York
Acemoglu D, De Feo G, De Luca G (2017) Weak states: causes and consequences of the Sicilian Mafia, MIT Department of Economics Working Paper No. 17-10
Alvazzi del Frate A, Mugellini G (2012) The crime drop in ‘non-western’countries: a review of homicide data. In: Dijk S et al (eds) The international crime drop: new directions in research. Palgrave MacMillan, London, pp 134–155
Andersson C, Kazemian L (2018) Reliability and validity of cross-national homicide data: a comparison of UN and WHO data. Int J Comp Appl Criminal Justice 42:287–302
Archer D, Gartner R (1984) Violence and crime in cross-national perspective. Yale University, New Haven
Biderman AD, Reiss AJ Jr (1967) On exploring the “Dark Figure” of crime. Annals 374:1–15
Bonger W (1916) Crime and economic conditions. Little Brown, Boston
Bullock K, Clarke RVG, Tilley N (2010) Situational prevention of organised crime. Willan, Cullompton
Chu DC, Tusalem RF (2013) The role of the state on cross-national homicide rates. Int Crim Justice Rev 23:252–279
Cohen LE, Felson M (1979) Social change and crime rate trends: a routine activity approach. Am Sociol Rev 44:588–608
Corcoran KE, Pettinicchio D, Robbins B (2018) A doubled-edged sword: the countervailing effects of religion on cross national violent crime. Soc Sci Q 99(1):378–389
Corcoran KE, Stark R (2018) Culture, region and cross-national violent crime. Sociol Forum 33(2):310–333
Corcoran KE, Stark R (2020) Regional, structural, and demographic predictors of violent victimization: a cross-national, multilevel analysis of 112 countries. Int Rev Victimol 26(2):1–19
Dijk JJM (2007) Mafia markers: assessing organized crime and its impact upon societies. Trends Organ Crime 10(4):39–56
Durkheim E (1897 (2005)) Suicide: a study in sociology, translated by J. A. Spaulding and G. Simpson. Routledge, London
Eisner M (2014) From swords to words: does macro-level change in self-control predict long-term variation in levels of homicide? Crime Justice 43(1):65–134
ENACT (2019) Organised Crime Index Africa. www.ocindex.net
Fijnaut C, Paoli L (2004) (eds) Organised crime in Europe. Concepts, patterns and control policies in the European Union and beyond. Springer Press, Dordrecht
Farrell G, Tilley N, Tseloni A (2014) Why the crime drop? Crime Justice 43(1):421–490
Felson M, Cohen LE (1980) Human ecology and crime: a routine activity approach. Hum Ecol 8:389–405
Fund For Peace (2017) Fragile State Index and CAST methodology guide. https://fragilestatesindex.org/2017/05/13/fragile-states-index-and-cast-framework-methodology/
Gallup World Poll (2020) Methodology consulted on March 16, 2020. www.fao.org/fileadmin/templates/ess/voh/Gallup_world_poll_methodology.pdfGallup. (2008)
Huebert ET, Brown DS (2019) Due process and homicide: a cross-national analysis. Polit Res Quart 72:190–204
Joudo Larsen J, Durgana DP (2017) Measuring vulnerability and estimating prevalence of modern slavery. Chance 30(3):21–29
Karstedt S (2015) Does democracy matter? Comparative perspectives on violence and democratic institutions. Eur J Criminol 12:457–481
Kaufmann D, Kraay A (2002) Growth without governance. World Bank Policy research working paper no. 2928
Kaufmann D, Kraay A, Mastruzzi M (2009) Governance matters 2009: learning from over a decade of the worldwide governance indicators, online: Brookings.edu
Koeppel MDH, Rhineberger-Dunn GM, Back KY (2015) Cross-national homicide: a review of the current literature. Int J Comp Appl Criminal Justice 39(1):47–85
LaFree G (1999) Summary and review of cross-national comparative studies of homicide. In: DwayneSmith M, Zahn MA (eds) Homicide: a sourcebook of social research. SAGE, Thousand Oaks, pp 125–145
LaFree G, Tseloni T (2006) Democracy and crime: a multilevel analysis of homicide trends in forty-four countries, 1950–2000. Ann Am Acad Polit Soc Sci 605(1):25–49
Lappi-Seppälä T, Lehti M (2014) Cross-comparative perspectives on global homicide trends. In: Tonry M (ed) Why crime rates fall and why they don’t. Uni of Chicago Press, Chicago
Lee M (2000) Community cohesion and violent predatory victimization: a theoretical extension and cross-national test of opportunity theory. Soc Forces 79(2):683–706
Lynch J (2006) Problems and promise of victimization surveys for cross-national research. Crime Justice 34(1):229–287
McCall PL, Land KC, Brooks Dollar C, Parker KF (2013) The age structure-crime rate relationship: solving a long-standing puzzle. J Quant Criminol 29:167–190
Merton RK (1938) Social structure and anomie. Am Sociol Rev 3:672–682
Morgan RE, Truman JL (2020) Criminal victimization, 2019. Bureau of Justice Statistics. (https://www.bjs.gov/index.cfm?ty=pbdetail&iid=7046)
Nieuwbeerta P (ed) (2002) Crime victimization in comparative perspective. Results from the international crime victims survey, 1989–2000. Boom Juridische Uitgevers, Den Haag
Nivette A (2011) Cross-national predictors of crime: a meta-analysis. Homicide Stud 15(2):103–131
Nivette AE, Eisner M (2013) Do legitimate polities have fewer homicides? A cross-national analysis. Homicide Stud 17(1):3–26
Pare PP, Felson R (2014) Income inequality, poverty and crime across nations. Br J Sociol 65:434–458
Park RE, Burgess EW (1925) (Eds) The city. University of Chicago Press, Chicago
Schwab K (2015) The global competitiveness report 2015–2016. Consulted on March 15, 2020. http://www3.weforum.org/docs/gcr/2015-2016/Global_Competitiveness_Report_2015-2016.pdf
Shaw CR, McKay HD (1942) Juvenile delinquency and urban areas. University of Chicago Press, Chicago
Stamatel JP (2016) Democratic cultural values as predictors of cross-national homicide variation in Europe. Homicide Stud 20(3):239–256
TI/Transparancey Intenational (2020) Corruption perception index (CPI), 2020
Transparency International (2015) Corruption perceptions index 2015: data and methodology. Consulted on March 15, 2020. https://www.transparency.org/cpi2015
UNODC (2019) Global study on homicide, 2019. UNODC, Vienna
United Nations Development Program (2013) Citizen security with a human face, evidence and proposals for Latin America; regional human development report 2013–2014. UNDP, New York
United Nations (2020) Population prospects (2020). https://population.un.org/wpp/
Urdal H (2006) A clash of generations? Youth bulges and political violence. Int Stud Quart 50(3):607–629
van Wilsem J (2004) Criminal victimization in cross-national perspective: an analysis of rates of theft, violence and vandalism across 27 countries. Eur J Criminol 1(1):89–109
van Dijk JJM (2008) The world of crime: breaking the silence on problems of security, justice and development across the world. Sage Publication Inc, Thousand Oaks
van Dijk JJM (2015) The case for survey-based comparative measures of crime. Eur J Criminol 12(4):437–456
van Dijk JJM, Mayhew P, Killias M (1990) Experiences of crime across the world; key findings from the 1998 international crime survey. Kluwer Law and Taxation, Deventer
van Dijk JJM, Tseloni A, Farrell G (eds) (2012) The international crime drop: new directions in research. Palgrave MacMillan
van Kesteren JN, van Dijk JJM, Mayhew P (2013) The international crime victims surveys: a retrospective. Int Rev Victimol 20(1):49–69
WEF (World Economic Forum) (2020) Executive opinion survey, 2020. World Economic Forum, Geneva
Wenmann A, Muggah R (2010) More violence, less development. Geneva Declaration Secretariat, Geneva. http://www.genevadeclaration.org/fileadmin/docs/MDG_Process/MoreViolenceLessDevelo pment.pdf
World Bank (2011) World development report 2011: conflict, security and development. World Bank, Washington, DC
World Bank (2020) World development indicators database. https://databank.worldbank.org/source/world-development-indicators
Wysmulek I (2019) Using public opinion surveys to evaluate corruption in Europe: trends in the corruption items of 21 international survey projects, 1989–2017. Qual Quant 53:2589–2610
Zimring FE (2006) The great American crime decline. Oxford University Press, Oxford
Acknowledgements
The authors express their gratitude to the Minderoo Foundation and Gallup Inc. for allowing access to data from Gallup World Poll.
Author information
Authors and Affiliations
Corresponding author
Ethics declarations
Conflict of interest
The authors declare that they have no conflict of interest.
Additional information
Publisher's Note
Springer Nature remains neutral with regard to jurisdictional claims in published maps and institutional affiliations.
The original online version of this article was revised: The incorrect data from the Tables 1, 3, 4, 7, 8, 9 and Appendix B has been corrected.
Electronic Supplementary Material
Below is the link to the electronic supplementary material.
Rights and permissions
Open Access This article is licensed under a Creative Commons Attribution 4.0 International License, which permits use, sharing, adaptation, distribution and reproduction in any medium or format, as long as you give appropriate credit to the original author(s) and the source, provide a link to the Creative Commons licence, and indicate if changes were made. The images or other third party material in this article are included in the article's Creative Commons licence, unless indicated otherwise in a credit line to the material. If material is not included in the article's Creative Commons licence and your intended use is not permitted by statutory regulation or exceeds the permitted use, you will need to obtain permission directly from the copyright holder. To view a copy of this licence, visit http://creativecommons.org/licenses/by/4.0/.
About this article

Cite this article
van Dijk, J., Nieuwbeerta, P. & Joudo Larsen, J. Global Crime Patterns: An Analysis of Survey Data from 166 Countries Around the World, 2006–2019. J Quant Criminol 38, 793–827 (2022). https://doi.org/10.1007/s10940-021-09501-0
Accepted:
Published:
Issue Date:
DOI: https://doi.org/10.1007/s10940-021-09501-0