
Abstract
The aetiological mechanism of gestational diabetes mellitus (GDM) has still not been fully understood. The aim of this study was to explore the associations between functional genetic variants screened from a genome-wide association study (GWAS) and GDM risk among 554 GDM patients and 641 healthy controls in China. Functional analysis of single nucleotide polymorphisms (SNPs) positively associated with GDM was further performed. Univariate regression and multivariate logistic regression analyses were used to screen clinical risk factors, and a predictive nomogram model was established. After adjusting for age and prepregnancy BMI, rs9283638 was significantly associated with GDM susceptibility (P < 0.05). Moreover, an obvious interaction between rs9283638 and clinical variables was detected (Pinteraction < 0.05). Functional analysis confirmed that rs9283638 can regulate not only target gene transcription factor binding, but it also regulates the mRNA levels of SAMD7 (P < 0.05). The nomogram model constructed with the factors of age, FPG, 1hPG, 2hPG, HbA1c, TG and rs9283638 revealed an area under the ROC curve of 0.920 (95% CI 0.902–0.939). Decision curve analysis (DCA) suggested that the model had greater net clinical benefit. Conclusively, genetic variants can alter women's susceptibility to GDM by affecting the transcription of target genes. The predictive nomogram model constructed based on genetic and clinical variables can effectively distinguish individuals with different GDM risk factors.
Introduction
Gestational diabetes mellitus (GDM) is one of the most common complications of pregnancy and is defined as the onset or the first discovery of glucose intolerance during pregnancy1. Worldwide, it affects approximately 2–20% of all pregnant women, but, in China, approximately 14.8% of pregnant women are affected2. Studies have confirmed that GDM can ultimately lead to adverse outcomes and long-term adverse effects on mothers and their offspring, such as foetal macrosomia, preeclampsia (PE), preterm birth, spontaneous abortion, respiratory distress syndrome, small for gestational age (SGA), large for gestational age (LGA), polycythemia, future obesity and type 2 diabetes mellitus (T2DM)3,4,5. GDM poses a serious threat to the health and quality of life of patients and their offspring6,7.
Similar to the pathogenesis of T2DM, GDM can be caused by insulin resistance and insufficient insulin secretion compensation8,9. Currently, the known causes of GDM include older age at pregnancy, prepregnancy overweight or obesity, excessive weight gain during pregnancy, family history of T2DM, and past history of GDM8,10. Epidemiological evidence shows that a family history of diabetes is an independent risk factor for GDM, and the closer individuals are to diabetes patients, the greater the risk of GDM is during pregnancy11,12. In addition, the incidence rate of GDM in Asian women during pregnancy is approximately 3–7 times greater than that in Caucasians13,14. This indicates that genetic factors are also involved in the pathogenesis of GDM. Therefore, identifying individual genetic risk factors for GDM is highly important for disease prevention and control.
Single nucleotide polymorphisms (SNPs) are the main variant form of the human genome and determine the core information of genetic susceptibility to disease. It has been widely applied in disease risk prediction and patient prognosis assessment15. SNPs located in different functional regions of genes may affect promoter and enhancer activity, alternative splicing, messenger RNA (mRNA) conformation and posttranscription level, protein function and structure and even cause changes in the biological traits of an individual16,17,18. Genome-wide association studies (GWASs) are considered an effective approach for detecting SNPs associated with complex disease phenotypes or traits across the entire genome, providing more genetic clues for the pathogenesis of human diseases. At present, a certain number of GDM susceptibility SNPs have been successfully identified14,19,20,21.
Disease prediction models can predict individuals’ probability of developing disease or experiencing certain conditions in the future22. Previous studies have extensively constructed GDM nomogram prediction models based on conventional clinical parameters (age, BMI, blood pressure, FPG, HbA1c, glucose and lipid levels, etc.) for early disease detection, prevention and treatment23,24,25. During the construction process of the nomogram model, the factors included in the model were scored based on the size of the logistic regression coefficients and then presented in the form of scaled line segments. The probability of corresponding outcome events occurring was determined by calculating the total score. This type of model can effectively predict the risk of individual GDM occurrence and help doctors make decisions through the use of visualized clinical predictions that provide personalized and highly accurate risk estimates26. However, there is a lack of risk factors characterized by genetic susceptibility as a predictive indicator. It is of great clinical significance to establish a practical risk prediction model for complex human diseases, including GDM prevention and control, by combining genetic variants and environmental risk factors.
Here, a large sample size case‒control study was conducted to validate the effects of SNPs screened by GWAS on the incidence of GDM. Subsequently, a nomogram model with GDM-positively associated SNPs and clinical indicators was constructed for early GDM prediction.
Methods
Study population
All subjects who met the following inclusion criteria were enrolled in the Affiliated Hospital of Guilin Medical University from September 2014 to April 2016: singleton pregnancy, no family relationship and no metabolic disease, such as type 1/2 diabetes mellitus. A routine 75-g oral glucose tolerance test (OGTT) was performed between 24 and 28 weeks of gestation. According to the standards of the International Association of Diabetes and Pregnancy Research Groups (IADPSG), women can be diagnosed with GDM if their fasting plasma glucose (FPG) is ≥ 5.1 mmol/L, 1-h plasma glucose (1hPG) is ≥ 10.0 mm/L or 2-h plasma glucose (2hPG) is ≥ 8.5 mmol/L.
At the initial discovery stage, 96 GDM patients and age and pre-BMI matched 96 healthy pregnant women from the same period were recruited to conduct a genome-wide association study (GWAS) for screening GDM associated SNPs (GDM-SNPs) by using infinium Asian Screening Array (ASA, illumina) BeadChip. During the validation phase, singleton pregnant women of the same conditions were recruited, and candidate SNPs were genotyped in 554 GDM patients and 641 healthy pregnancies. In addition, biological samples from the other 42 normal pregnant women, including peripheral whole blood and placental tissues, were collected to detect the biological functions of the positively associated variants.
The Ethics Committee of Guilin Medical University approved this research (Number: GLMC20131205), and the study was conducted in accordance with the Declaration of Helsinki. All included subjects signed informed consent forms prior to study procedures. The details of this study design are depicted in the flowchart in Fig. 1.
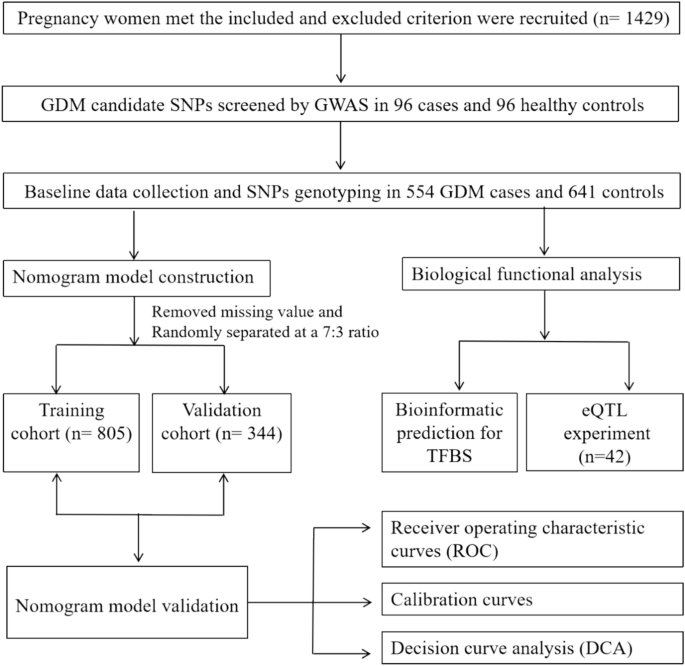
The flowchart of the study design. TFBS indicated transcription factor-binding sites, e QTL indicated expression quantitative trait locus.
Infinium Asian screening array (ASA)
All DNA samples were extracted using DNA-extraction kits (Tiangen Biotech). Genotyping module of Genomestudio v2.1 (illumina) was used to call the genotype, and to obtain high-quality data for GWAS. We pruned the data set of discovery stage with the following criteria: (1) SNP call rate > 95%, and a threshold for Hardy–Weinberg equilibrium (HWE) of 0.0001, minimum allele frequencies (MAF) < 1% and sex chromosome SNP sites; (2) Sample call rates > 95%; In addition, to exclude closely related individuals, we calculated genome-wide identity by descent (IBD) for each pair of samples and removed samples with PI-HAT > 0.25. We took group analysis quality control from 1000Geomics Northern and Western European Ancestry (CEU), Japanese in Tokyo (JPT) and Han Chinese in Bejing (CHB) database to Confirm whether the sample grouping meets expectations and detect outlier samples.
Clinical and biochemical characteristics
Clinical and biological characteristics, including age, prepregnancy weight (kg), height (m), systolic blood pressure (SBP), diastolic blood pressure (DBP), fasting plasma glucose (FPG), 1-h plasma glucose (1hPG), 2-h plasma glucose (2hPG), triglyceride (TG), total cholesterol (TC), haemoglobin A1c (HbA1c), low-density lipoprotein cholesterol (LDL-c) and high-density lipoprotein cholesterol (HDL-c), etc., were obtained from a unified questionnaire and patient medical records.
Candidate SNP selection and genotyping
Preliminary selection of candidate SNPs was based on the strength of the association effect on GDM (P < 1.0 × 10⁻³) according to the Infinium Asian Screening Array (ASA) BeadChip. The SNP function prediction (FuncPred) tool (https://manticore.niehs.nih.gov/snpinfo/snpfunc.html) was subsequently used for screening potential functional variants in the Chinese Han population in Beijing (CHB) with minimum allele frequencies (MAF) greater than 0.05.
The candidate variants were genotyped via the Sequenom MassARRAY platform. The multiplex PCR master mix was composed of 1.0 μl of template DNA (20 ~ 100 ng/μl), 1.850 μl of ddH2O, 0.625 μl of 1.25 × PCR buffer (15 mmol/L MgCl2), 0.325 μl of 25 mmol/L MgCl2, 0.1 μl of 25 mmol/L dNTPs, 1 μl of 0.5 μmol/L primer mix, and 0.1 μl of 5 U/μl HotStar Taq polymerase. The reaction was conducted at 94 °C for 15 min, followed by 45 cycles at 94 °C for 20 s, 56 °C for 30 s and 72 °C for 1 min, with a final incubation at 72 °C for 3 min. The primers used are listed in Supplemental Table S1.
Functional analysis of positively associated SNPs
For positively associated SNPs located in TFBSs, the Alibaba 2.1 tool (http://gene-regulation.com/pub/programs/alibaba2/index.html ) was used to explore potential biological functions. In addition, to determine whether the SNP was an expression quantitative trait locus (eQTL), we also carried out validated experiments in our study.
According to the Aidlab DNA Extraction Kit (Aidlab Biotechnology Co., Ltd., China), genomic DNA was extracted from peripheral blood of 42 healthy pregnant women, and then the optical density values of each sample at 260 nm and 280 nm were measured using a NanoDrop spectrophotometer (Thermo Scientific, Waltham, MA, USA) to determine the DNA concentration and purity. Next, the genotypes of the candidate SNPs were determined using Kompetitive Allele Specific Polymerase Chain Reaction (KASP)27 in a StepOnePlus™ real-time PCR system (Thermo Fisher Scientific, Life Technologies Holding Pte Ltd., China). The 10-µl reaction system contained 5 µl of Flu Arms 2 × PCR mix, 0.5 µl of three specific primers (F1: 0.1 µl, F2: 0.1 µl, and R: 0.3 µl), 0.5 µl (25–150 ng) of DNA and 4 µl of ddH2O. The cycling conditions were as follows: hot-start Tap activation at 95 °C for 3 min, followed by 10 touchdown cycles at 95 °C for 15 s and at 61–55 °C for 60 s (61 °C decreasing to 0.6 °C per cycle to achieve a final annealing and elongation temperature of 55 °C), followed by 30 amplification cycles at 95 °C for 15 s, 55 °C for 60 s and postread at 30 °C for 60 s. The primer sequences are shown in Supplemental Table S1.
Total RNA was extracted from the placental tissues of 42 normal pregnant women using TRIzol reagent (Invitrogen, Carlsbad, CA, USA) according to the manufacturer’s instructions. The concentration and purity of the extracted RNA were tested using a Thermo Scientific Nanodrop-2000c microspectrophotometer. Total RNA (2 µg) was reverse transcribed into cDNA according to the instructions for the reverse transcription kit (HaiGene, Harbin, China). Finally, quantitative real time polymerase chain reaction (QRT-PCR) was performed using the GLPBIO SYBR Green qPCR Mix (2 ×) kit on the StepOne Plus TM real-time PCR system. The 10 µl RT‒qPCR system contained 1 µl of cDNA template, 5 µl of 2 × SYBR Green PCR Mastermix, 2 µl of forwards and reverse primer concentrations and 3.4 µl of DEPC ddH2O. The PCR mixtures were denatured at 95 °C for 10 min, followed by 40 cycles of 95 °C for 15 s and 65 °C for 60 s. The 2^(− ΔΔCt) method was used to quantify gene expression, with GAPDH serving as an internal control28. The primer sequences are shown in Supplemental Table S1.
Data processing
In this study, the data were processed with IBM SPSS Statistics 28 for Windows (IBM Corp., Armonk, NY, USA) and R 4.3.1 software. Clinical and biochemical variables are shown as the mean ± SD or percentage and were analysed using independent sample t tests or chi square (χ2) tests. Logistic regression analysis was adopted to evaluate the association between variants and GDM risk with the odds ratio (OR) and its corresponding 95% confidence interval (CI). One-way ANOVA was used to compare expression levels among the different genotypic samples. Additionally, univariate logistic regression and multivariate regression analysis by forwards stepwise selection with the Akaike information criterion (AIC) were employed to determine the clinical risk factors for GDM.
A predictive nomogram model composed of clinical risk factors and positive SNPs was eventually constructed using the R package “rms”. The area under the receiver operating characteristic curve (AUC) was used to evaluate the model’s performance. The calibration curve by internal validation with a bootstrap method with 1000 resamples was generated to assess the level of consistency between the predicted and observed values. The clinical utility and net benefit were estimated by decision curve analysis (DCA). Finally, a web-based interactive dynamic nomogram was established via the R package “DynNom”. A two-sided test was adopted, and P values < 0.05 were considered to indicate statistical significance.
Results
Patient characteristics
The selected characteristics of the patients are shown in Table 1. There were no significant differences in TC, HDL-c or LDL-c between the two groups (P > 0.05). However, the mean age, pre-BMI, SBP, DBP, FPG, 1hPG, 2hPG, HbA1c and TG levels in GDM patients were much greater than those in controls (P < 0.05).
Candidate SNPs Screening
According to the GWAS, a large amount of GDM associated SNPs were screened (Fig. 2). Based on the established variant screening strategy, 5 SNPs were ultimately selected, of which 4 SNPs (rs17099985, rs9283638, rs6798181, rs796749) were predicted to be located at transcription factor-binding sites (TFBS), and one SNP (rs1742473) was predicted to be located at a splicing site (SS) (Supplemental Table S2).

Manhattan plot demonstrating the -log10 P value for the SNPs in the gestational diabetes mellitus genome-wide association study at the discovery stage. The red line represents the genome-wide significance threshold (P = 5 × 10⁻⁴).
SAMD7 rs9283638 C > T and GDM risk
The frequency distribution of the three genotypes of the 5 variants followed the Hardy Weinberg equilibrium (HWE) law (PHWE > 0.05) in the control group. Significant differences in the genotype distribution of rs9283638 were observed between GDM patients and controls (χ2 = 9.06, P = 0.011) (Table 2).
Unconditional logistic regression analysis revealed that rs9283638 was significantly associated with GDM risk. Compared with the CC genotype, the TT genotype increased GDM risk by 54% (TT vs. CC: crude OR = 1.54, 95% CI 1.05–2.26, P = 0.029). However, after adjusting for age and BMI, the positive associations previously described no longer existed. However, we did find a significant correlation with GDM risk in the recessive model (TT vs. CC/CT: adjusted OR = 1.57, 95% CI 1.06–2.32, P = 0.025) as shown in Table 2.
According to the stratified analysis, compared with individuals with the CT/TT genotype, individuals with the rs9283638 TT genotype had a greater risk of GDM in the age > 30.09 years (adjusted OR = 2.80, 95% CI 1.45–5.41, P = 0.002), DBP ≤ 69.53 mmHg (adjusted OR = 1.75, 95% CI 1.06–2.91, P = 0.035) and TG subgroup ≤ 2.54 mmol/L (adjusted OR = 2.20, 95% CI 1.29–3.75, P = 0.004) subgroups. A significant interaction effect of rs9283638 with age (Pinteraction = 0.017) was observed under the recessive model (Table 3).
However, there was no significant association between GDM risk and other variants (rs17099985, rs1742473, rs6798181 and rs796749) in the present study (P > 0.05) (Table 2).
Functional analysis of positively associated SNPs
According to bioinformatic analysis, the rs9283638 polymorphism located at a TFBS can change the types of transcription factors binding to the promoter region under different alleles, which may affect gene transcription (Fig. 3a and b). Furthermore, expression quantitative trait locus (eQTL) analysis of placental tissues revealed that rs9283638 C > T could significantly regulate the mRNA levels of SAMD7 (P = 0.017). As shown in Fig. 4a and b.

The prediction for the transcription factor binding site (TFBS) using AliBaba 2.1. (a) The transcription factors of rs9283638 C allele in 97–106 bp. (b) The transcription factors of rs9283638 T allele in 101–110 bp.

Schematic diagram of the genotyping of rs9283638 and the expression quantitative trait locus (eQTL) analysis of SAMD7. (a) rs9283638 genotyping plot by Kompetitive Allele Specific Polymerase Chain Reaction (KASP-PCR). (b) Analysis of SAMD7 differential expression level under different genotypes. *P < 0.05.
Variable screening and nomogram establishment
Through the univariate and multivariate logistic regression analysis, 6 clinical factors were considered risk factors for GDM: age, FPG, 1hPG, 2hPG, HbA1c and TG. Considered the rs9283638 was associated with an increased GDM risk, the predictive nomogram model was eventually constructed with the positive SNP (rs9283638 recessive model) and significant clinical factors (Supplemental Table S3). The patients were randomly assigned to the training and validation cohorts at a 7:3 ratio; thus, there were 805 patients in the training set and 344 patients in the validation set. The GDM risk can be predicted based on the sum of assigned points for each risk factor’s level. Higher total scores indicate that GDM events are more likely to occur (Fig. 5a). In addition, to facilitate the use of nomograms for clinicians, we constructed a dynamic nomogram online to visualize the predictive results for GDM. The probability of GDM occurrence can be easily determined by inputting personal values of risk indicators into the web-based application (Fig. 5b–d).

The static and dynamic nomogram for predicting individual GDM risk. (a) A static nomogram for GDM risk prediction. Each risk indicators corresponding to level can be given different scores, and the total scores obtained by adding these scores from all variables can use to predict the GDM risk. (b) The risk variables input panel of the online dynamic nomogram (https://qiulianl.shinyapps.io/GDM Predict/). (c) Person GDM predictive results’ graph visualization. (d) Showing individual GDM predictive probability and its corresponding 95% confidence intervals.
Validation of the nomogram
The predictive nomogram had an area under the curve (AUC) of 0.920 (95% CI 0.902–0.939, P < 0.001) in the training cohort and 0.834 (95% CI 0.778–0.890, P < 0.001) in the validation cohort, indicating the good discriminating ability of the model (Fig. 6a and b). The nomogram calibration plot was roughly close to the ideal line, revealing good agreement between the predicted and observed values (Fig. 6c and d). As shown in the DCA analysis, the model curves for most of the risk threshold probabilities were above the two lines (“treat all” or “treat none”), suggesting that the nomogram model had greater net clinical benefit (Fig. 6e and f).

Validation of the nomogram. (a) Receiver operating characteristic (ROC) curves in training set with an area under the curve (AUC) of 0.920, cutoff value of 0.428, specificity of 80.6%, sensitivity of 89.9%. (b) ROC curve in validation set with a AUC of 0.834. (c) Calibration plot in training set conducted by a bootstrap method with 1000 resamples. (d) Calibration plot in validation set conducted by a bootstrap method with 1000 resamples. (e) A decision curve analysis (DCA) in training set. (f) DCA curve in validation set.
Discussion
GDM is considered to pose a serious threat to the short-term and long-term health of mothers and their offspring29. Identifying high-risk populations for GDM is particularly useful for early intervention and prevention of disease progression30,31. Although significant progress has been made in identifying the mechanism of GDM susceptibility, they have not been fully understood. It is now recognized that GDM is a multifactorial disease and exhibits a clear genetic tendency. That is, genetic variants may alter individuals’ genetic susceptibility to GDM, even under the same environmental conditions32,33. Here, while clarifying the association between genomic SNPs and GDM, we further attempted to construct a nomogram predictive model to predict the risk of GDM in pregnant women. It is believed to be of great social significance for the prevention and control of GDM.
In the present study, we observed a significant association between rs9283638 and the risk of GDM in the population of Guilin, China. This finding is consistent with the findings of numerous previous studies8,10,13,14,19,20,21. Meaning, there are obvious genetic characteristics involved in the pathogenesis of GDM, and a series of associated genes and SNPs are involved in disease occurrence at the genetic level. Furthermore, these findings suggest that the studied SNPs exert different effects on different levels of some clinical indicators, and significant interactions have been observed between rs9283638 and age. Similarly, Kwak SH et al. reported that the CDKAL1 SNP rs7754840 was significantly associated with insulin expression, inhibition of insulin secretion in pancreatic β-cells and birth weight of a baby20, while Polina V et al. suggested that genetic variants of MTNR1B (rs10830963 and rs1387153) can reduce early insulin secretion through parallel signalling pathways in pancreatic β-cells, thereby regulating glucose metabolism34. These findings indicated that genetic variants may modify the genetic background of an individual or, combine with environmental features or clinical traits, may affect individuals’ susceptibility to complex human diseases. Personal differences associated with GDM may be affected by SNPs or SNP-environmental factor interactions.
It is speculated that the construction of a predictive model can serve as an important bridge between clinical epidemiology or molecular epidemiology and clinical practice, and it could become an effective means of identifying high-risk populations, guiding clinical diagnosis and treatment, promoting the prevention and control of complex diseases, and improving patient clinical prognosis35,36. The nomogram prediction model integrates multiple disease-related indicators and draws scaled line segments on the same plane in a certain proportion to express the relationships between selected variables. The model quantifies the occurrence rate and high-risk factors for GDM risk, intuitively representing the probability of patients developing GDM, and provides personalized risk assessment for subjects 26,37,38.
Given the independent hazard effect of environmental and genetic factors on the pathogenesis of GDM, this study incorporated validated SNPs significantly associated with GDM and clinical indicators (age, FPG, 1hPG, 2hPG, HbA1c and TG) to construct a GDM risk prediction nomogram model. This model demonstrated a good ability to distinguish individual GDM risks, with an area under the ROC curve of 0.920. The genetic-clinical model can help clarify the probability of women developing GDM during pregnancy, thereby identifying high-risk individuals and leading to personalized prevention. It is extremely important to accurately prevent GDM in individuals during early pregnancy.
The potential gene expression regulatory region variants not only serve as genetic markers but also may affect individual physiological and pathological manifestations by regulating the expression of genes or interacting with environmental exposure factors, making them suitable for revealing the susceptibility mechanisms of complex traits and diseases. For example, the functional variant rs10830963 was associated with GDM risk by regulating the expression levels of the MTNR1B gene, fasting blood glucose, fasting insulin, and homeostasis model assessment for insulin resistance39. In the present study, we found that rs9283638 is significantly associated with the risk of GDM and has significant interactions with age. Furthermore, we found that the above association findings seem to be biologically plausible. Functional analysis suggested that rs9283638 C > T can affect transcription factor binding to specific binding motifs and alter the transcription of the SAMD7 gene. In addition, mRNA level detection in placental tissues revealed that rs9283638 can be an eQTL that regulates the expression levels of SAMD7 mRNA. This finding provides new insight into the biological genetic mechanism of susceptibility to GDM.
However, this study has several limitations. First, as a hospital-based case‒control study, there will inevitably be bias in subject selection and data collection. Second, potential confounding factors of GDM, such as smoking status, poor obstetrics, malnutrition, and socioeconomic factors, were not assessed. These factors are likely to interfere with the true effects of the association between the studied variants and GDM risk. Third, the very low frequency of genotypes tested in the studied variants may still limit the statistical performance, especially in subgroup analysis. Finally, limited in-depth biological functional analysis of significantly associated variants was conducted in this study.
In the present study, we confirmed that rs9283638 is significantly related to the risk of GDM. The potential mechanism may involve independent genetic risk effects and genetic-environmental interactions affecting female individuals′ susceptibility to GDM. Based on key genetic SNPs and clinical parameters, a predictive nomogram model with good potential for the early identification and prevention of GDM has been successfully established.
Data availability
The datasets generated and/or analysed during the current study are available in the dryad repository, doi: https://doi.org/https://doi.org/10.5061/dryad.fj6q5743m.
References
Goedegebure, E. A. R. et al. Pregnancy outcomes in women with gestational diabetes mellitus diagnosed according to the WHO-2013 and WHO-1999 diagnostic criteria: A multicentre retrospective cohort study. BMC Pregnancy Childbirth 18, 152 (2018).
Gao, C., Sun, X., Lu, L., Liu, F. & Yuan, J. Prevalence of gestational diabetes mellitus in mainland China: A systematic review and meta-analysis. J. Diabetes Investig. 10, 154–162 (2019).
Coustan, D. R. Pregnancy outcomes in women with and without gestational diabetes mellitus according to the international association of the diabetes and pregnancy study groups criteria. Obstet. Gynecol. 121, 377 (2013).
Farrar, D. et al. Hyperglycaemia and risk of adverse perinatal outcomes: Systematic review and meta-analysis. BMJ 354, i4694 (2016).
Li, M. et al. Genetic factors and risk of type 2 diabetes among women with a history of gestational diabetes: Findings from two independent populations. BMJ Open Diabetes Res. Care 8, e000850 (2020).
Xiang, A. H. Diabetes in pregnancy for mothers and offspring: reflection on 30 years of clinical and translational research: The 2022 Norbert Freinkel award lecture. Diabetes Care 46, 482–489 (2023).
Zeng, J. et al. Association of maternal obesity and gestational diabetes mellitus with overweight/obesity and fatty liver risk in offspring. World J. Gastroenterol. 28, 1681–1691 (2022).
Plows, J. F., Stanley, J. L., Baker, P. N., Reynolds, C. M. & Vickers, M. H. The pathophysiology of gestational diabetes mellitus. Int. J. Mol. Sci. 19, 3342 (2018).
You, H., Hu, J., Liu, Y., Luo, B. & Lei, A. Risk of type 2 diabetes mellitus after gestational diabetes mellitus: A systematic review & meta-analysis. Indian J. Med. Res. 154, 62–77 (2021).
Chen, P. et al. Risk factors and management of gestational diabetes. Cell Biochem. Biophys. 71, 689–694 (2015).
Zhou, Y., Xie, N., Zhang, L. & Chen, D. Impact of family history of diabetes on blood glucose, lipid levels and perinatal outcomes in pregnant women with gestational diabetes mellitus. Zhejiang Da Xue Xue Bao Yi Xue Ban 50, 329–334 (2021).
Monod, C. et al. Prevalence of gestational diabetes mellitus in women with a family history of type 2 diabetes in first- and second-degree relatives. Acta Diabetol. 60, 345–351 (2023).
Benny, P. et al. Genetic risk factors associated with gestational diabetes in a multi-ethnic population. PLoS One 16, e0261137 (2021).
Wei, W. et al. Gestational diabetes mellitus: The genetic susceptibility behind the disease. Horm. Metab. Res. 53, 489–498 (2021).
Acosta-España, J. D. & Voigt, K. Mini review: Risk assessment, clinical manifestation, prediction, and prognosis of mucormycosis: Implications for pathogen- and human-derived biomarkers. Front. Microbiol. 13, 895989 (2022).
Li, G. Expression quantitative trait loci analysis in multiple tissues. Methods Mol. Biol. 2082, 231–237 (2020).
McRae, A. F. et al. Identification of 55,000 replicated DNA methylation QTL. Sci. Rep. 8, 17605 (2018).
Prasad, R. B., Kristensen, K., Katsarou, A. & Shaat, N. Association of single nucleotide polymorphisms with insulin secretion, insulin sensitivity, and diabetes in women with a history of gestational diabetes mellitus. BMC Med. Genom. 14, 274 (2021).
Dalfrà, M. G., Burlina, S., Del Vescovo, G. G. & Lapolla, A. Genetics and epigenetics: New insight on gestational diabetes mellitus. Front. Endocrinol. (Lausanne) 11, 602477 (2020).
Kwak, S. H. et al. A genome-wide association study of gestational diabetes mellitus in Korean women. Diabetes 61, 531–541 (2012).
Wu, N. N. et al. A genome-wide association study of gestational diabetes mellitus in Chinese women. J. Matern. Fetal Neonatal Med. 34, 1557–1564 (2021).
Sammani, A., Baas, A. F., Asselbergs, F. W. & Te Riele, A. Diagnosis and risk prediction of dilated cardiomyopathy in the era of big data and genomics. J. Clin. Med. 10, 921 (2021).
Tong, J. N. et al. Fasting plasma glucose in the first trimester is related to gestational diabetes mellitus and adverse pregnancy outcomes. Endocrine 75, 70–81 (2022).
Zhang, D. et al. A clinical model and nomogram for early prediction of gestational diabetes based on common maternal demographics and routine clinical parameters. J. Obstet. Gynaecol. Res. 48, 2738–2747 (2022).
Zhang, X. et al. Risk prediction model of gestational diabetes mellitus based on nomogram in a Chinese population cohort study. Sci. Rep. 10, 21223 (2020).
Li, S., Li, H., Li, C., He, X. & Wang, Y. Development and validation of a nomogram for predicting the risk of pregnancy-induced hypertension: A retrospective cohort study. J. Womens Health (Larchmt) 30, 1182–1191 (2021).
He, C., Holme, J. & Anthony, J. SNP genotyping: The KASP assay. Methods Mol. Biol. 1145, 75–86 (2014).
Livak, K. J. & Schmittgen, T. D. Analysis of relative gene expression data using real-time quantitative PCR and the 2(-Delta Delta C(T)) Method. Methods 25, 402–408 (2001).
Moon, J. H. & Jang, H. C. Gestational diabetes mellitus: Diagnostic approaches and maternal-offspring complications. Diabetes Metab. J. 46, 3–14 (2022).
Clarke, E., Cade, T. J. & Brennecke, S. Early pregnancy screening for women at high-risk of GDM results in reduced neonatal morbidity and similar maternal outcomes to routine screening. J. Pregnancy 2020, 9083264 (2020).
Zhang, C., Rawal, S. & Chong, Y. S. Risk factors for gestational diabetes: Is prevention possible?. Diabetologia 59, 1385–1390 (2016).
Wu, Q. et al. An early prediction model for gestational diabetes mellitus based on genetic variants and clinical characteristics in China. Diabetol. Metab. Syndr. 14, 15 (2022).
Xie, K. et al. Genetic predisposition to gestational glucose metabolism and gestational diabetes mellitus risk in a Chinese population. J. Diabetes 11, 869–877 (2019).
Popova, P. V. et al. Association of common genetic risk variants with gestational diabetes mellitus and their role in GDM prediction. Front. Endocrinol. (Lausanne) 12, 628582 (2021).
Niu, Z. R., Bai, L. W. & Lu, Q. Establishment of gestational diabetes risk prediction model and clinical verification. J. Endocrinol. Investig. 47, 1281–1287 (2023).
Lin, Q. & Fang, Z. J. Establishment and evaluation of a risk prediction model for gestational diabetes mellitus. World J. Diabetes 14, 1541–1550 (2023).
Li, W. et al. Predictive nomogram of RAGE Genetic polymorphisms and metabolic risk factors for myocardial infarction risk in a Han Chinese population. Angiology 68, 877–883 (2017).
Tang, G. et al. Evaluation and analysis of incidence and risk factors of lower extremity venous thrombosis after urologic surgeries: A prospective two-center cohort study using LASSO-logistic regression. Int. J. Surg. 89, 105948 (2021).
Konig, M. & Shuldiner, A. R. The genetic interface between gestational diabetes and type 2 diabetes. J. Matern. Fetal Neonatal Med. 25, 36–40 (2012).
Funding
This study was supported by: Guangxi Science and Technology Base and Talent Special Project (AD24010027); self-funded research project of The Health Committee of Guangxi (Z-C20241580); the Guangxi Natural Science Foundation of China (2020GXNSFAA238025); Guangxi Young and middle-aged teachers' basic ability improvement project (2020KY12028); Maternal and Child Health Research Project of Guangxi Bagui Scholars (Jun Zhang).
Author information
Authors and Affiliations
Contributions
Conceptualization: X.Y.Y., Q.L.L.; Data curation: L.M.; Formal analysis: Q.L.L., Y.S.; Investigation:Y.S., R.Q.L.; Methodology: X.Y.Y., Q.L.L.; Software: G.C.H., Q.L.L.; Visualization: G.C.H.; Writing-original draft: G.C.H., Y.S., Q.L.L.; Writing-review & editing: X.Y.Y., R.Q.L. All authors reviewed the article and approved the submitted version.
Corresponding authors
Ethics declarations
Competing interests
The authors declare no competing interests.
Additional information
Publisher's note
Springer Nature remains neutral with regard to jurisdictional claims in published maps and institutional affiliations.
Supplementary Information
Rights and permissions
Open Access This article is licensed under a Creative Commons Attribution-NonCommercial-NoDerivatives 4.0 International License, which permits any non-commercial use, sharing, distribution and reproduction in any medium or format, as long as you give appropriate credit to the original author(s) and the source, provide a link to the Creative Commons licence, and indicate if you modified the licensed material. You do not have permission under this licence to share adapted material derived from this article or parts of it. The images or other third party material in this article are included in the article’s Creative Commons licence, unless indicated otherwise in a credit line to the material. If material is not included in the article’s Creative Commons licence and your intended use is not permitted by statutory regulation or exceeds the permitted use, you will need to obtain permission directly from the copyright holder. To view a copy of this licence, visit http://creativecommons.org/licenses/by-nc-nd/4.0/.
About this article

Cite this article
Huang, G., Sun, Y., Li, R. et al. Functional genetic variants and susceptibility and prediction of gestational diabetes mellitus. Sci Rep 14, 18123 (2024). https://doi.org/10.1038/s41598-024-69079-y
Received:
Accepted:
Published:
DOI: https://doi.org/10.1038/s41598-024-69079-y
- Springer Nature Limited