
Abstract
This work introduces a novel metastructure designed for quasi-zero-stiffness (QZS) properties based on the High Static and Low Dynamic Stiffness mechanism. The metastructure consists of four-unit cells arranged in parallel, each incorporating inclined beams and semicircular arches. Under vertical compression, the inclined beams exhibit buckling and snap-through behavior, contributing negative stiffness, while the semicircular arches provide positive stiffness through bending-dominated behavior. The design procedure to achieve QZS is established and validated through finite element analysis and experimental investigations. The static analysis confirms a QZS region for specific displacement. Dynamic behavior is analyzed using a nonlinear dynamic equation solved using the Harmonic Balance Method, validated experimentally with transmissibility curves showing sudden jump down with effective vibration isolation. Parametric studies with varied payload masses and excitation amplitudes further verify the ability to of metastructure to attenuate vibrations effectively in low-frequency ranges.
Introduction
Mechanical vibration is widely present in engineering structures, which deteriorates the performance of machinery1,2,3, reduces the service life of precision instruments4, impacts human health5, and more. Therefore, it is crucial to protect the host structures from undesirable vibrations. Traditionally, linear passive vibration isolators can control vibrations in high and low-frequency ranges beyond \(\sqrt{2}\) times the natural frequency of the system. However, isolating vibrations in low-frequency ranges has been a significant challenge for researchers, as achieving a low natural frequency requires either low stiffness or high mass. To enhance isolation performance at low frequencies, nonlinear methods using nonlinear stiffness6,7,8 and damping characteristics9,10,11 have been adopted. Fortunately, quasi-zero-stiffness (QZS) mechanism-based nonlinear passive isolators substantially neutralize the shortcomings of linear isolators by designing systems that operate efficiently in low-frequency ranges without compromising load-bearing capacity12,13,14.
The QZS system operates on the High Static and Low Dynamic Stiffness (HSLDS) mechanism, implying that a system can be designed for high load-bearing capacity with a low-natural frequency for targeted loading15. Generally, a QZS isolator includes a combination of positive and negative stiffness structures. The element with high positive stiffness values incorporates small static deflection, while the element with negative stiffness neutralizes the total stiffness value in a certain displacement range. This arrangement helps to reduce dynamic stiffness and enhance vibration isolation characteristics. Various techniques have been utilized to achieve negative stiffness characteristics, including combinations of two structures or individual structures. Researchers have realized negative stiffness mechanisms (NSM) using elastic buckled beams16,17,18,19, oblique springs20,21,22,23,24,25,26, magnetic springs27,28,29,30,31, cam-roller mechanisms32,33,34, metamaterials35,36,37,38,39, disk springs28,29,40, bionic structures11,41,42,43, and pneumatic actuators44,45. However, most studies have used linear spring models to attain positive stiffness mechanisms (PSM). Additionally, the primary focus of researchers has been to develop various methods to achieve negative stiffness.
The initial configuration to achieve NSM is based on the arrangement of inclined springs. Carrella et al.46,47,48 and Kovacic et al.21 proposed and developed a QZS isolator using two oblique springs and one linear spring, further studying the static and dynamic characteristics of the isolator along with stability analysis. The dynamic analysis results suggest an excellent vibration isolation performance of the QZS isolator in low-frequency ranges compared to linear vibration isolators. Gatti49 and Zhao et al.26 used two pairs of oblique springs to increase the QZS region and studied the dynamic behavior of the developed model. To withstand large deformation and increase the QZS range, Liu and Yu23 and Zhao et al.24 used three pairs of oblique springs and experimentally studied the dynamic behavior for large amplitude vibrations. The use of oblique springs has the limitation of large geometrical size to achieve NSM, which is not beneficial for practical applications in high-weight-to-strength ratio14.
Different geometrical configurations were explored to achieve QZS behavior and widen the vibration isolation range in low-frequency ranges to overcome the mentioned limitation. Thanh et al.50 proposed an isolator with two horizontal springs and two connecting rods to mitigate vibration reaching the driver seats. To increase the compactness of the isolator, Euler’s buckled beam was used as the negative stiffness corrector by51,52 for the detuning of load and stiffness characteristics. Shaw et al.53 proposed a QZS model with an adjustable configuration by placing the masses at different modal structures, which helps in adjusting the stiffness and symmetry of the device independently. Sun et al.54 obtained QZS behavior using four horizontal springs acting as scissor-like structures and one vertical spring, Cheng et al.55 designed a scissor-like structure to obtain nonlinear stiffness as well as damping and achieved improved isolation performance in the low-frequency range. Further, Lu et al.56 performed a comparative study to analyze the effect of linear and nonlinear damping on the isolation performance. The results suggest better isolation in the low-frequency range with nonlinear damping.
Recently, QZS isolators have also been developed using magnetic springs and a cam-roller mechanism. Magnetic springs have certain advantages, such as there is no direct contact, so the effect of friction can be avoided, and electromagnets can also replace permanent magnets to add active control to the vibration isolator. Zhou et al.57 used a pair of repelling magnets as a negative stiffness mechanism with a coil spring acting as a linear spring to achieve QZS behavior, whereas Zheng et al.58 also used a similar arrangement to reduce the natural frequency of the QZS system and achieved improved vibration isolation in six directions. Different magnetic arrangements are used to achieve NSM for different applications, such as Wang et al.59 used two magnetic rings to achieve a larger load range, Zhao et al.60 designed a precision instrument for absolute displacement measurement using electromagnets as NSM, Yuan et al.61 designed QZS with tunable electromagnetic ring for large working stroke.
Further, researchers also achieved QZS using a cam-roller mechanism and performed dynamic analysis to achieve isolation in low-frequency ranges62. One of the benefits of using a cam-roller mechanism is that the profile of the cam can be optimized, Li et al.32,33 designed noncircular and user-defined based cam-profile, respectively, for achieving the QZS behavior and also achieved vibration isolation in varying frequency ranges. Lopez-Martinez et al.63 designed three different cam profiles to achieve QZS using parabolic cams, springs, and rollers. Vibration isolation in torsional and translational directions simultaneously can also be achieved using the cam-roller structures64.
Inspired by the negative stiffness of origami metamaterials, Liu et al.36 introduces a new quasi-zero stiffness (QZS) vibration isolation system with positive stiffness spring compensation, using the folding ratio as the principal coordinate to establish the static model and define the negative stiffness mechanism. In other work, Liu et al.65 proposed an origami-inspired vibration isolator with QZS characteristics by integrating elastic joints based on the Tachi–Miura origami carton geometry to form a nonlinear stiffness model. Further, a truss-spring based stack Miura-ori (TS-SMO) structure is introduced to achieve QZS characteristics for the application as vibration isolation system66. Some of the works67,68 also discussed the application of origami-inspired metamaterials to isolate the vibration in low-frequency region.
The bio-inspired QZS metastructure based isolators have also been developed to isolate the unwanted vibration disturbances in wide frequency ranges. Niu and Chen69 and Zhao et al.26 designed a compliant limb-like structure to induce nonlinearity in the system and obtained a quasi-zero stiffness region. Han et al.70 proposed a NiTi-NOL circular ring-type single-element isolator by inducing stiffness and damping nonlinearities to obtain the QZS characteristics. Zhang et al.71 used a topology optimization technique to design a single-element model for obtaining QZS characteristics. The same methodology is used by72 to obtain a constant-force mechanism for vibration isolation. Some of the literature38,73 discussed the mechanism of using compact structures to obtain QZS and further use it for vibration isolation applications.
To further enhance the width of the QZS region so that large amplitude excitations can get isolate in low-frequency regions, Liu et al.74 proposed a higher-order stable QZS method composed of seven magnets and two linkages and experimentally obtained isolation region starting from 2.62 Hz for the 5th order QZS isolator. In other work75, a novel in-plane QZS vibration isolator composed of two magnetic rings that are radially magnetized and eight cables that are pre-tensioned is proposed for isolating horizontal vibration when the excitation is applied from two arbitrary direction in the horizontal plane. A review article discussed the ongoing application of electromagnetic mechanism for low-frequency nonlinear vibration isolation76. Kamaruzaman et al.77 presents a comparison between passive and active stability analyses of a six degree of freedom QZS magnetic levitation vibration isolation system. By varying the lever arms, the passive rotational stability of the system is adjusted, and its effects on vibration isolation performance and control cost are investigated through static and dynamic simulations. More investigations have been performed to enhance the QZS properties for supporting multiple loads78,79,80,81. Moreover, recent article by Liu et al.82 reviews the development of QZS vibration isolation technology, focusing on designs, improvements, and applications. It discusses construction approaches for QZS isolators, multi-degree-of-freedom systems, enhancement strategies, and engineering applications.
The QZS characteristics is based on the HSLDS mechanism, hence the isolators designed based on this property can isolate vibration for varying frequency ranges starting from lower frequency range to higher. Further, the QZS characteristics is material independent property as it depends on the deformation behavior of ductile materials, hence QZS based isolators possess wide range of applications in different industries such as-
-
Aerospace applications: To isolate vibrations in satellite payloads and precision instruments on aircraft.
-
Optical systems: To mitigate vibrations from reaching telescopes, and positioning of telescopic mounts.
-
Medical imaging devices: To provide stable environment for MRI machines to produce high-quality images, and in high-precision microscopes to ensure stable imaging.
-
Semiconductor manufacturing: To isolate sensitive equipment and maintain the necessary stability.
-
Precision instruments and laboratories: To maintain the stability required for accurate results.
-
Industrial machinery: Manufacturing of microelectronics assembly requires stable environment and accuracy.
As discussed, QZS isolators have applications focused mainly on the field of engines, vehicle seats, etc. However, the need for isolation in small precision instruments, microwave apparatus, binoculars, etc., is still in demand because of the size constraints. Meanwhile, to overcome this limitation, mechanical metamaterials can be used because of their peculiar properties, such as negative stiffness, high energy dissipations, bistable behavior, high damping ratio, and negative position ratio83. These properties can effectively help in mitigating wave propagation and help in reducing vibration at low-frequency ranges13. Auxetic metamaterial exhibiting negative Poisson’s ratio also helps in absorbing and dissipating the vibration energy, whereas origami material also helps in vibration isolation for broad bandwidth38. With the recent advancement in additive manufacturing processes, metamaterials can be designed and used for energy absorption. As the material properties of the metamaterials are material independent and depend majorly on the geometric configurations, the unit cell consisting of inclined beams and curve beams can be designed to achieve the snap-through or buckling behavior with a high strength-to-weight ratio, which is the main principle behind the shock absorptions84,85,86.
This work investigates a compact lightweight metastructure with high static and low dynamic stiffness. The metastructure is designed to exhibit stable QZS behavior to isolate vibration at low-frequency ranges, with the application majorly based on precision instruments. The structure is modeled using the inclined beam exhibiting negative stiffness and semicircular arch counteracting the negative stiffness to obtain the QZS behavior. Further, a dynamic study is performed to observe the nonlinear behavior along with stability analysis. In addition, samples are fabricated using a rapid-prototyping technique, and experiments are performed to validate the static and dynamic behavior. Here, the proof of concept is shown where the mass can be customized based on the frequency requirement by varying the geometrical parameters, which can tune the design as per the mass requirement of the practical application.
The paper is arranged in the following sequence, starting with the design of the prototype in section "Conceptual design of the prototype", explaining the mechanism behind the structure and developing the analytical model. Further, the static characteristics are studied in section "Static characteristics" with analytical, numerical, and experimental studies. Based on the static study results, the dynamic performance is analyzed in section "Dynamic characteristics" by developing analytical model for frequency response and stability analysis and finally studying the vibration performance of the proposed metastructure experimentally.
Conceptual design of the prototype
The unit cell of the designed model, as depicted in Fig. 1a, incorporates a combination of inclined beams and semicircular arches. These unit cells are subsequently aligned in parallel to construct the metastructure, as illustrated in Fig. 1b. Upon placing a mass on the top plate of the metastructure, the inclined beam is subjected to buckling, resulting in negative stiffness, while the semicircular arch, through its bending-dominated behavior, contributes positive stiffness to balance the negative stiffness. A mass is positioned atop the metastructure and sinusoidal excitation is introduced at the bottom plate. This configuration allows the metastructure to serve as a platform for isolating unwanted vibrations from affecting the mass at the top.

(a) Unit cell, (b) Metastructure.
Mechanism behind the structure
A bistable mechanism consisting of two beams of length \(L\) inclined at an angle \(\beta\), is illustrated in Fig. 2. These beams are symmetrically arranged, with one end of each beam fixed and the other end attached to a moving platform. When an external force \(P\) is exerted at the top of this platform, the inclined beams, along with the platform, experience a vertical displacement denoted by \(\delta\). As the applied force increases, the inclined beam displays nonlinear behavior, transitioning through stable and unstable states, which are characterized by distinct mode shapes as illustrated in Fig. 3. Initially, the beam remains in a stable state; however, with further increase in displacement, the beam undergoes snap-through to another stable state, also referred to as the bistable state. The period during which snap-through occurs corresponds to the unstable state, represented by dashed lines in Fig. 3.

Deformation of the inclined beams under axially downward force. The dotted line represents the initial stable state of the system, and the solid red line represents the unstable state.

The buckling behavior of an inclined beam representing stable and unstable states.
The buckling behavior of the beams indicates that the structural energy within the beam comprises both bending and compression energy. As the beams begin to buckle, the bending energy increases continuously, whereas the compression energy rises to a peak at the centerline before it starts to decrease. The inclined beams are designed so that the reduction in compression energy surpasses the increase in bending energy due to the snap-through behavior; this results in a region of negative stiffness within the inclined beam87. The design of the proposed model is based on this mechanism, whereby the negative stiffness generated is balanced by the positive stiffness provided by the semicircular arch. Both the inclined beams and the semicircular arch must be carefully designed with specific parameters to achieve the desired quasi-zero-stiffness (QZS) behavior.
During the deformation of inclined beams, the axial force each beam exerts on the moving platform is equal and symmetric, ensuring the platform moves strictly downward in the axial direction. When the fixed end of a beam aligns with the guided end connected to the moving platform (depicted as a solid red line in Fig. 2), the system reaches an unstable equilibrium state. At this point, the external force is entirely supported by the in-plane lateral forces, with no axial force contributing, which triggers the snap-through of the beam to another stable state. The lateral forces exerted by each of the beams, \({P}_{1}\) and \({P}_{2}\), are equal and opposite due to the symmetry of the mechanism. Consequently, the movement of the platform in the lateral direction is restricted; thus, only the axial component of the force is considered in the current study.
Under vertical loading, the semicircular arch primarily exhibits bending-dominated behavior, characterized by a linear positive stiffness region. The semicircular arches are designed specifically so that their positive stiffness effectively counteracts the negative stiffness demonstrated by the inclined beams. These beams and arches are organized into what is known as the unit cell, as depicted in Fig. 1a. Additionally, these unit cells are aligned in parallel to construct the metastructure, as illustrated in Fig. 1b.
Analytical modeling of the inclined beam and semicircular arch
The post-buckling behavior of the inclined beam is studied in this section. It is assumed that the deformation is bending-dominated, and the end of the beam deflects in the axial direction, whereas the length of the beam remains constant. Figure 4 shows an initially horizontal beam with length \(L\) being subjected to an end load \(\gamma F\) and an end moment \({M}_{0}\). The end load can be divided into a horizontal force \(\lambda F\) and a vertical force \(F\), \(\phi\) is the angle of end force with the \(x\)-axis, \({\theta }_{0}\) represents the deflected angle at the beam end, and \(\left(a,b\right)\) represents the coordinates of the beam at the guided end that is attached to the platform.

Deflected configuration of a beam under end-load \(\gamma F\) and moment \({M}_{0}\).
In addition, it is assumed that the vertical force \(F\) is always positive and \({R}_{0}\) is introduced to denote the sign of the moment \({M}_{0}\) as,
and,
Consider an arbitrary point \(A\) with coordinates \(\left(x,y\right)\) on the deflected beam. According to the Euler–Bernoulli beam theory, the moment \(M\) is given by:
where \(\frac{d\theta }{dr}\) is the curvature and \(EI\) is the flexural rigidity. From, Fig. 4, \(M\) can also be given by,
Substituting Eq. (4) into Eq. (3), the curvature equation can be rewritten as:
In the above equations, the “\(+\)” sign signifies the concave curvature upwards, and the “−” sign signifies the concave curvature downwards. Detailed derivation can be seen in ref.88
Equation (6) can be rearranged as,
where,
and
\(k\) denotes the load ratio, \(\alpha\) is defined as the force index88:
Integrating Eq. (7) for the whole curvature,
Form Eq. (11), the force index \(\alpha\) can also be defined as,
For defining the movement at the tip of the beam, the expression for the coordinates \((a,b)\) needs to be defined. From Fig. 4, it can be seen that:
Substituting Eq. (13) into Eq. (11) and integrating,
Substituting Eq. (10) into Eq. (14),
Equations (15) and (12) collectively represent the general formula for the post-buckling analysis of beams under large deformation conditions. Various approaches have been explored to solve large deformation problems, including finite element models89, elliptical integral models90,91, chained-beam constraint models92, and chain algorithms93. Among others, Ma and Chen92 evaluated different methods for solving the bistable compliant mechanism in their study and implemented the chained-beam constraint model. On the other hand, Zhang and Chen76 conducted an extensive study of the elliptical integral solution.
It can be observe that, the chained beam method clearly provides a more precise identification of the first mode of the inclined beam. Conversely, the elliptical integral solution offers a closed-loop solution that is more effective in analyzing the linear negative stiffness curve. Given that the inclined beam in this work exhibits a linear negative stiffness region, the elliptical integral solution method is employed to solve the derived general equation.
In the fixed-guided scenario, when a vertical force \({F}_{v}\) is applied to the platform, the beam undergoes bending, and the slope at the ends of the beams is constrained due to the motion being restricted in the axial direction, meaning that \({\theta }_{0}\approx 0\). As the angle at both the fixed and guided ends remains constant, this configuration inevitably leads to the presence of at least one inflection point. Geneally, in cases involving large deformations, only one or two inflection points are considered. These inflection points correspond to different buckling mode shapes of the beam.
For the fixed-guided inclined beam mechanism, each inflection point marks a change in the curvature of the beam, signifying that the internal resisting moment vanishes at these points. Figure 5a illustrates the fixed-guided case where \({\theta }_{0}\approx 0\) and \({F}_{v}\) denotes the applied vertical force at the guided end of the beam.

(a) Represents the deflected and undeflected path of fixed-guided mechanism, and (b) represents the force and moment acting on the guided end of the beam.
Solving the derived Eqs. (12) and (15) using the elliptical integral solution and substituting the fixed-guided condition \({\theta }_{0}\approx 0\)94, we obtain:
in which \(\alpha , \gamma ,\lambda\) are the parameters already discussed earlier. \((a/L, b/L)\) denote the \((x, y)\) coordinates of the guided end tip, \({R}_{r}\) is be defined as:
where, \({R}_{r}\) denotes the sign of the moment of the fixed end \({M}_{r}\), \({R}_{0}\) denotes the sign of the moment of the guided end \({M}_{0}\), and \(m\) denotes the number of inflection points. The parameters \(f, e, c\) can be defined as:
where, \({\lambda }_{1}\) is the elliptic integral amplitude at the fixed end and \(t\) is the modulus, which can be expressed as:
And \(\eta\) is computed by substituting \({\theta }_{0}\approx 0\) in Eq. (8):
\(F(\gamma ,t)\) denotes the incomplete elliptical integral of the first kind and \(E(\gamma ,t)\) denotes the incomplete elliptical integral of the second kind, which can be given by91:
\(t\) represents the modulus \(\left(-1\le t\le 1\right)\) and \(\gamma\) represents the amplitude of elliptical integral. For \(\gamma =\pi /2\), Eqs. (24) and (25) became complete integrals of the first and second kind and denoted as \(F\left(t\right)\) and E \(\left(t\right)\). When the force is applied on the moving platform, the guided beam gets displaced by displacement \(\delta\) shown in Fig. 5a, where \(\beta\) is the inclination angle of the beam. The coordinates \((a,b)\) can be computed as:
For the applied displacement \(\delta\) and the known inclination angle \(\beta\), the value of guided end coordinates \((a,b)\) can be calculated from Eqs. (26) and (27). Substituting the known values of \(a\) and b into Eq. (17), the value of \(\lambda\), \(\gamma\) (from Eq. (2)) and \(c\) (from Eq. (21)) can be calculated. Substituting the values of \(c\), \(\lambda\) and \(\gamma\) into Eq. (17), a relation between \(f\) and \(e\) can be obtained, which is further used to find the value of \(t\) by performing a numerical iteration in Eqs. (19) and (20). Further, the obtained value of \(t\) is substituted into Eqs. (22) and (8) to calculate the value of \(\eta\) and \(k\) respectively94. Finally, the values of \(F\) and \({M}_{0}\) (depicted in Fig. 5b) can be obtained using Eqs. (9), (10), and (16).
Based on the derived analytical model, the reaction force of the single inclined beam at the guided end can be expressed as :
Since the proposed model consists of two inclined beams to achieve symmetry and balance the in-plane lateral force, the total reaction force of the beam \({F}_{b}\) is then expressed as:
The buckling behavior of the fixed-guided inclined beam, as illustrated in Fig. 6, can be observed through the developed model. Initially, the deformation exhibits the beam in its first mode shape characterized by a single inflection point (A). As the deformation increases, the beam transitions into the second mode shape, which includes two inflection points (B and C). The force–displacement characteristics of the inclined beam, along with the relevant design parameters, are further explored in section "Mechanical model of the structure".

Buckling behavior of fixed-guided inclined beam depicting the obtained two mode shapes, where (A–C) represent the inflection points.
The vertical force acting on the semicircular arch leads to the bending of the arches. In this regard, the arch acts as a linear spring with constant positive stiffness as shown in Fig. 7. The stiffness \({k}_{s}\) of a single arch is directly proportional to the elastic modulus \(E\) and second moment of inertia \({I}_{2}\) and inversely proportional to the cube of the length of the arch \({l}_{2}\) and it can be expressed as95:

Non-dimensional force–displacement curve of a single semi-circular arch.
Here, \(\nabla\) is a non-dimensional coefficient that depends on the cross-section of the arch. The numerical value of \(\nabla\) is determined according to the study by Fan et al.96. Fan et al. carried out a series of FEA analyses and plotted the non-dimensional stiffness versus the non-dimensional parameter \({t}_{2}/{l}_{2}\) (\({t}_{2}\) is the thickness of semi-circular arch). Nonlinear regression analysis was then carried out to find that \(\nabla =18.257\), and it is valid for the case of constant arch width. This relation is used in section "Mechanical model of the structure" to design the semi-circular arch.
Mechanical model of the structure
A unit cell in the structure is composed of inclined beams and semicircular arches, with their respective dimensions detailed in Fig. 8. For the inclined beam, L represents the length, \(\beta\) denotes the inclination angle with the \(x\)-axis, \(I\) is the second moment of inertia of the cross-section, and \(t\) indicates the thickness. Regarding the semicircular arch, \({L}_{2}\) represents the length, \({t}_{2}\) is the thickness, \({I}_{2}\) denotes the moment of inertia of the cross-section, and \(R= {L}_{2}/4\) specifies the radius of the arch. Both the width and Young’s modulus are consistent across components and are denoted as \(b\) and \(E\), respectively.

Represents the dimensions of the inclined beam and semicircular arch.
To evaluate the performance of the inclined beam, the parameters specific to it are defined and listed in Table 1. By applying an initial deflection \(\delta\) to the moving platform, the inclined beam is subjected to deformation. From this deformation, the force \(F\) and the parameter \(\lambda\) can be determined using the analytical model developed in section "Analytical modeling of the inclined beam and semicircular arch", based on the design parameters reported in Table 1.
The values of force and various parameters obtained from the analytical solution are presented in Table 2. Further, by substituting the obtained values of force \(F\) into Eq. (29), the total reaction force of the beam \({F}_{b}= 2{F}_{v}\) is calculated and plotted against the applied displacement \(\delta\) in Fig. 9.

The force–displacement curve of inclined beams depicting negative stiffness region in segment BD.
The force–displacement curve is analyzed in three distinct segments:
-
(i)
Segment AB represents the initial positive stiffness linear region, triggered by the initial buckling of the beam.
-
(ii)
Segment BD represents the linear negative stiffness region, induced by the snap-through behavior of the inclined beam during buckling.
-
(iii)
Segment DE depicts the linear positive stiffness region post-buckling of the beam.
It is also noted that point C represents the unstable equilibrium point of the beam, where the axial reaction force is zero. As discussed in section "Mechanism behind the structure", at this equilibrium point, the external force is completely supported by the in-plane lateral force of the beams.
The segment BD is the working region for the proposed design, as this segment exhibits an excellent negative stiffness region. The negative stiffness can be calculated as the slope of segment BD:
If the obtained negative stiffness region is connected in parallel to the equivalent positive stiffness region, then a quasi-zero stiffness region can be achieved. Therefore, the semicircular arch should be designed to exhibit positive linear stiffness of magnitude \(2{k}_{s}=0.13711\) N/mm. Here, \(2{k}_{s}\) is considered because the stiffness expression in Eq. (30) is for a single semicircular arch. Consequently, the parameters required to design the semicircular arch are reported in Table 3 (calculated from Eq. (30)). The width and Young’s modulus are considered the same as those of the inclined beams. The force–displacement curve obtained from Eq. 30 is shown in Fig. 10, where \(2{k}_{s}\) represents the slope of the designed semi-circular arch.
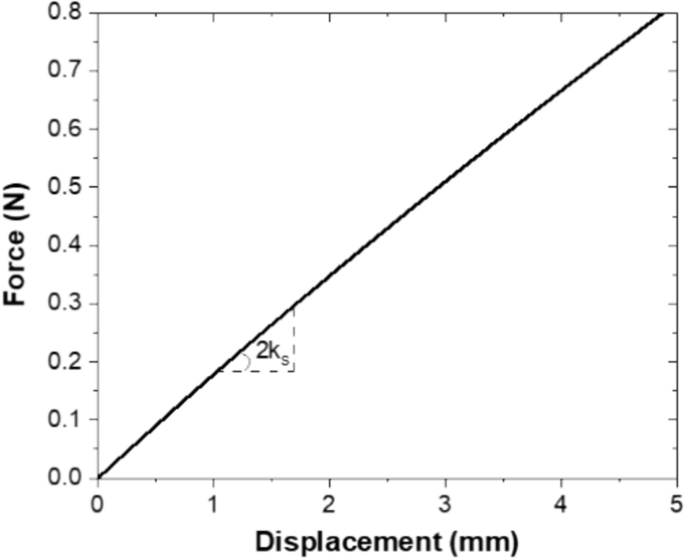
Force–displacement curve of semi-circular arch depicting stiffness \({k}_{s}\).
The parallel springs theory states that the equivalent stiffness is the sum of the stiffness of individual springs connected in parallel. Hence, the equivalent stiffness for a unit cell \({k}_{eq-uc}\) is expressed as:
Substituting the values of \({k}_{b}\) (from Eq. (31)) and \({k}_{s}\) (from Eq. (30)) and using the parameters mentioned in Table 3 into Eq. (32), we obtain:
It can be observed from Eq. (33) that an almost zero-equivalent stiffness is achieved for the unit cell in segment BD (Fig. 9). As a result, the distance between B and D can be defined as the quasi-zero-stiffness region.
To obtain the force–displacement relation for the unit cell \({F}_{eq-uc}\), the reaction force value of the beam \({F}_{b}\) and arches \({F}_{s}\) can be calculated for a displacement \(\delta\) as follows:
The force–displacement curve of the unit cell is illustrated in Fig. 11. Within the segment BD, a quasi-zero-stiffness (QZS) region is observed, where the reaction force remains constant despite increasing displacement. Conversely, segments AB and DE display a linear stiffness behavior.

The force–displacement curve of unit cell obtained from analytical model.
To further enhance the design, a metastructure is configured by arranging four unit cells in a parallel orientation. According to parallel spring theory, the equivalent stiffness of the metastructure is the sum of the stiffness of each unit cell when subjected to a uniform load. Consequently, the relationships for stiffness-displacement and force–displacement for the metastructure can be described as follows:
In the above, \({k}_{eq-ms}\) and \({F}_{eq-ms}\) represent the equivalent stiffness and force of the metastructure, respectively. The static behavior of the proposed model is further explored both experimentally and numerically in the subsequent section.
Static characteristics
The quasi-zero-stiffness (QZS) behavior of the designed model is based on the High Static and Low Dynamic (HSLDS) mechanism, which allows for significant load-bearing capacity while simultaneously exhibiting approximately zero-stiffness due to imposed geometrical nonlinearity in the form of nonlinear stiffness. This section examines these static characteristics through numerical and analytical studies and corroborates them with experimental results.
Fabrication of samples using a 3D printing technique
In this study, three distinct samples were fabricated to demonstrate different aspects of the design: (i) an inclined beam showing negative stiffness, (ii) a unit cell composed of an inclined beam and semicircular arches that exhibit QZS, and (iii) a metastructure also demonstrating QZS. These samples are fabricated based on the parameters delineated in Tables 1 and 3. The fabrication employs the additive manufacturing method (3D printing), specifically the Fused Deposition Modeling (FDM) technique, which includes the following printing specifications: an infill density of 100%, a hexagonal infill pattern, a layer height of 0.1 mm, a nozzle diameter of 0.3 mm, and a base print speed of 2 mm/s.
The samples are depicted in Fig. 12. The black material used is Thermoplastic Polyurethane (TPU), which is known for its elasticity and high toughness, making it a significant engineering material widely utilized in industrial applications. The orange material is Polylactic Acid (PLA), which behaves more plastically and is utilized here as stiff walls providing base support. The components were printed separately using both materials and subsequently assembled for experimental testing.

3D printed sample.
Numerical simulations
In this work, the designs are modeled in SOLIDWORKS 2020®, and Finite Element Analysis (FEA) is conducted using ANSYS 2021R® simulation software to examine the mechanical behavior of the proposed inclined beam, unit cell, and metastructure. The static behavior is analyzed within the static structural module, where meshing is performed using tetrahedral elements. A mesh convergence study is also conducted to ensure the accuracy of the analysis. Given the buckling behavior of the beam under deformation, re-meshing criteria are adopted to facilitate the study of the nonlinear behavior of the models.
To replicate the real-time experimental conditions, the base of the sample is fixed in all six degrees of freedom, including three translational and three rotational. The top plate is restricted to five degrees of freedom, permitting only downward translational motion. A quasi-static downward vertical displacement is applied using a step size approach, and large deflection settings are enabled to capture the nonlinear behavior and identify the buckling modes of the inclined beam. The boundary conditions are illustrated in Fig. 13.

Finite element model of unit cell representing boundary conditions.
Quasi-static experiments
The compression experiment is conducted using a uniaxial tensile testing machine, applying displacement at a controlled strain rate of 1 mm/min. The static behavior of the samples is recorded in the force–displacement curve, and the buckling mode shapes are captured using cameras.
Results and discussion
This section explores the static behavior of the inclined beam, unit cell, and metastructure through analytical, numerical, and experimental methods. The results are analyzed based on the force–displacement curve, stiffness-displacement curve, and the response of the samples to different mode shapes under various vertical displacements.
The static behavior of the inclined beam under vertical displacement is analyzed in Fig. 14; the analytical results are derived from Eq. (29) (discussed in section "Analytical modeling of the inclined beam and semicircular arch"), while the numerical results are sourced from the simulation methodology (discussed in section "Numerical simulations"). These results are then corroborated with experimental outcomes. As shown in the experimental results of Fig. 14, the reaction force increases to 0.20 N as the displacement rises from 0 to 1 mm, indicative of the initial buckling behavior of the inclined beam in the first mode shape. As the displacement extends from 1 to 3.9 mm, the inclined beam undergoes snap-through, leading to instability and a sudden decrease in reaction force from 0.20 to 0.025 N, marking a region of negative stiffness. As displacement continues to increase to 5 mm, the reaction force rises again as the inclined beam stabilizes in another stable state. Based on these force–displacement results, the force–displacement relation is established using the curve fit technique, and subsequently, the stiffness-displacement curve is plotted in Fig. 15. The experimental curve demonstrates that as displacement increases, the stiffness decreases, and during the deflection range of 1 to 3.9 mm, the stiffness of the beam drops to a value of (−0.1) N/mm, representing the negative stiffness region, before increasing again.

Comparison of force–displacement curves obtained from analytical, numerical, and experimental for inclined beam.

Comparison of stiffness-displacement curves obtained from analytical, numerical, and experimental for inclined beam.
The numerical results align well with the experimental outcomes for both the force–displacement and stiffness-displacement curves, albeit some discrepancies are observed due to fabrication errors, since the sample is 3D printed in parts and subsequently assembled into a metastructure. For numerical simulations, the model is imported from SOLIDWORKS, whereas, for the experimental studies, the samples are 3D printed layer by layer, which could impact the behavior of the inclined beam. Analytical models also show reasonable agreement; however, deviations arise due to the assumptions made, such as considering fixed support for one end of the inclined beam and strictly axial deformation at the other end with the moving platform, which is challenging to replicate practically. Therefore, the developed analytical equations are valid under the specified conditions of the structure.
In the linear region of the force–displacement curve, the experimental and numerical results show good agreement, while the analytical results exhibit some variations. This discrepancy could be attributed to the use of the elliptical integral solution technique in the analytical study, which is employed to solve the general equation for post-buckling of beams considering large deformation. The elliptical integral solution provides a closed-loop solution that is effective for studying the linear negative stiffness region, a characteristic displayed by the inclined beam under vertical deformation. The solution also covers linear positive stiffness regions effectively.
A comparative analysis of the numerical and experimental responses of the inclined beam under vertical displacement is depicted in Fig. 16. The behavior of the inclined beam is evident across different deformation modes:
-
Figure 16a illustrates the initial condition of the inclined beam with no applied displacement.
-
Figure 16b shows the buckling behavior during the snap-through, leading to negative stiffness with two inflection points, representing the two mode shapes of the beam. Symmetrical behavior is also noted for both inclined beams.
-
Figure 16c displays the other stable state achieved due to the snap-through behavior. The numerical results correlate well with the observed experimental mode shapes.

Comparison of the behavior of inclined beam obtained from numerical and experimental results under different vertical displacements.
The static behavior of the unit cell under vertical displacement is detailed in Fig. 17. The unit cell comprises inclined beams and semicircular arches to demonstrate QZS behavior. The analytical model is derived by solving Eq. 35 (see section "Mechanical model of the structure"), and the numerical simulation follows the methodology previously discussed. The experimental outcomes depicted in Fig. 17 are analyzed across three regions of the force–displacement curve:
-
1.
The first region shows positive stiffness, where the force increases from 0 to 0.45 N as the displacement extends from 0 to 1.6 mm. During this phase, the beam starts exhibiting the first mode shape (referenced in Fig. 6) and demonstrates a positive stiffness region, while the semicircular arch undergoes bending and shows a linear positive stiffness.
-
2.
The second region maintains the force constant at approximately 0.45 N from displacements ranging 1.6–3.9 mm, leading to a QZS region. The beam experiences snap-through, crosses the unstable equilibrium state, enters the second mode shape (noted in Fig. 6), and exhibits a negative stiffness region, while the arch continues to bend, showing positive stiffness, combining with the beam to exhibit a QZS region.
-
3.
The third region starts from 3.9 to 5 mm displacement, where force increases from 0.6 to 0.7 N, representing a positive stiffness region. The beam, after snap-through, reaches another stable state and demonstrates positive stiffness, which, combined with the arch’s stiffness, presents a positive stiffness region.

Comparison of force–displacement curves obtained from analytical, numerical, and experimental for the unit cell.
The stiffness-displacement curve, shown in Fig. 18, is derived by differentiating the force–displacement relation from Fig. 17 using a curve fitting method. It reveals that in the displacement range of 2 to 4 mm, the stiffness hovers around 0 N/mm, indicating the QZS region. Hence, the designed unit cell exhibits nonlinear static behavior under applied vertical force. Comparing analytical and numerical results with experimental data, it is evident that numerical results closely match the experimental findings, while analytical results, though near, show slight variations due to idealized conditions assumed in model formulations and potential material property alterations from 3D printing.

Comparison of stiffness-displacement curves obtained from analytical, numerical, and experimental for the unit cell.
Different mode shapes of the unit cell under vertical deformation during numerical simulation and experimental studies are captured and shown in Fig. 19. Figure 19a illustrates the initial condition of the unit cell with no applied displacement. As displacement increases, the inclined beam undergoes buckling and reaches the second mode shape with two inflection points (as shown in Fig. 19b) during the snap-through, while the semicircular arch undergoes bending, observable in Fig. 19b. With further increase in displacement, the beam goes through snap-through to reach another stable state (as shown in Fig. 19c), and the semicircular arch exhibits further bending behavior to demonstrate positive stiffness. It is noted that the mode shapes obtained from numerical simulations align with those captured experimentally.

Comparison of the behavior of unit cell obtained from numerical and experimental results under different vertical displacements.
The unit cells are organized in parallel to form a metastructure that acts as a platform for supporting a mass and demonstrating quasi-zero-stiffness (QZS) characteristics. The proposed model utilizes the high static and low dynamic stiffness mechanism, as evidenced experimentally in Fig. 20. The analytical curve is generated using Eq. (37), and numerical results are derived using the methodology discussed in section "Numerical simulations".

Comparison of force–displacement curves obtained from analytical, numerical, and experimental for metastructure.
As shown in Fig. 20, in the initial phase, with an increase in displacement from 0 to 1.9 mm, the force also increases from 0 to 1.45 N. This initial positive stiffness region provides high static stiffness to support a load of 1.45 N. As displacement increases from 1.9 to 3.9 mm, the metastructure enters a transition phase where the force remains approximately constant at 1.45 N, defining this as the quasi-zero stiffness region where dynamic stiffness is notably low (approximately zero). Due to vertical displacement, the beam buckles and undergoes snap-through, exhibiting negative stiffness, while the semicircular arch undergoes bending-dominated behavior and exhibits positive stiffness, effectively countering the negative stiffness to exhibit QZS. With a further increase in displacement to 5 mm, the force again increases to 3 N, indicating positive stiffness. The QZS region represents the primary functional range of the proposed model.
Based on the force–displacement results, the stiffness-displacement relation is derived using the curve fit technique, and the stiffness-displacement curve is plotted in Fig. 21. In the displacement region from 1.9 to 3.9 mm, the obtained stiffness is approximately zero and is symmetric about a displacement of 2.9 mm. This symmetry indicates the positive linear stiffness regions before and after the QZS region. It is also noted that the analytical and numerical results align closely with the experimental findings. The analytical solution deviates somewhat due to the ideal conditions assumed in the model, such as fixed support at one end and strict axial deformation at the guided end. Furthermore, in the experimental setup, models are fabricated using two different materials and finally assembled, which may also influence the experimental outcomes.

Comparison of stiffness-displacement curves obtained from analytical, numerical, and experimental for metastructure.
The displacement behavior of the metastructure during the experiment and numerical simulations is captured and compared in Fig. 22. Figure 22a shows an isometric view of the proposed metastructure. As displacement increases, the transition zone from positive to quasi-zero stiffness is evident in Fig. 22b, showcasing the second buckling mode shape of the inclined beam with two inflection points during the snap-through behavior, while the semicircular arch demonstrates bending behavior. The symmetric deformation of the beam and arch, indicative of the metastructure’s stability, represents the QZS region, which is the main working region of the proposed metastructure. Figure 22c illustrates the other stable state of the inclined beam leading to the shift of metastructure stiffness from quasi-zero to positive.

Comparison of the behavior of metastructure obtained from numerical and experimental results under different vertical displacements.
The static analysis confirms that the proposed model under downward vertical displacement exhibits nonlinear static behavior based on the high static and low dynamic stiffness mechanism. Experimentally, a static stiffness of 137.11 N/m is achieved with a QZS payload of 1.45 N, resulting in a QZS region of 2 mm. These results validate the analytical and numerical predictions with experimental data. The obtained static results will serve as a basis for the dynamic behavior study in section "Dynamic characteristics".
Dynamic characteristics
The static analysis results suggest that the proposed metastructure exhibits quasi-zero-stiffness characteristics under vertical deformation. The designated QZS region is where the dynamic stiffness of the system is low, corresponding to low natural frequencies. This section investigates the dynamic behavior of the model to assess the vibration isolation capabilities of the metastructure across low-frequency ranges. Both analytical and experimental methodologies are employed to examine the dynamic properties of the proposed system. The investigation begins with the formulation of a dynamic equation and its solution using the Harmonic Balance Method. Subsequently, experiments are conducted to evaluate the vibration isolation performance of the system.
Analytical modeling of dynamic equation
To study the dynamic equation for nonlinear isolators, it is better to convert the static relationship of the metastructure into a non-dimensional form. This is achieved by applying curve-fitting techniques to the experimental results displayed in Fig. 20, using regression analysis. Figure 23 illustrates the curve-fit model employing both third-order and fifth-order polynomials. It can be shown that the fifth-order polynomial provides a closer fit to the experimental data, with an \({R}^{2}\) value nearing 1, compared to the third order. The obtained non-dimensional equation for the fifth order is expressed as:

Curve-fit of experimental data obtained in static analysis.
The equivalent spring-dashpot-mass model is shown in Fig. 24. The mass is supported by a spring exhibiting nonlinear behavior and a viscous damper. Under a base excitation, the equation of motion of the system can be expressed as:
where \(X\) denotes the relative displacement between mass and base, \({F}_{qzs}\left(X\right)\) denotes the nonlinear static force in dimensional form, \(\ddot{Y={Y}_{0}\text{sin}(\omega t)}\) is the excitation acceleration applied at the base and \(c\) is the damping coefficient. Equation (39) can be non-dimensionalized by introducing the following constants and variables:
in which \({\omega }_{n}\) is the natural frequency of the equivalent linear model, \(x\) is the non-dimensional relative displacement, \(\xi\) is the damping ratio, \({y}_{0}\) is the non-dimensional excitation amplitude, \(\tau\) is the non-dimensional time, and \(\Omega\) is the frequency ratio. Substituting Eq. (40) into Eq. (39), the equation of motion can be rewritten in non-dimensional form:

Spring-mass model for the dynamic study.
The (\({\prime}\)) denotes the derivative with respect to the non-dimensional time \(\tau\), \({f}_{qzs}\) is the non-dimensional force–displacement relation. Equation (41) represents the dynamic equation, which exhibits a steady-state vibration response around the static equilibrium position under small excitation amplitudes. This equation can also be articulated as a nonlinear dynamic equation. Solving this equation involves two components: a particular integral solution and free vibration. As damping is incorporated, the free vibration term diminishes over time. To solve the particular integral, various methods have been utilized by researchers—such as the perturbation method, method of multiple scales, averaging method, and harmonic balance method (HBM). Among these, HBM is particularly advantageous because it is not limited to only weakly nonlinear problems and can converge to an accurate periodic solution for nonlinear systems97. Carrella. A98 applied HBM to address the nonlinear dynamic equation, noting that omitting higher order harmonic terms and presuming the response to be purely harmonic does not yield precise solutions to the duffing equation. However, when the linear term of the restoring force equation is more significant than the nonlinear term, using the first order harmonic balance method results in a reasonable approximate solution, particularly when the primary concern is the output response at the excitation frequency, as this simplifies the mathematical resolution99. One limitation of HBM is that it requires separate analysis to assess the system’s stability. In this study, HBM is employed to solve the nonlinear differential equation to derive the steady-state vibration response.
The single mode of Harmonic Balance can be expressed as:
\(A\) is the amplitude and \(\psi\) is the phase response. Substituting Eq. (42) into Eq. (41) and solving the eigenvalue problem we obtain:
where
The frequency response curve, depicted in Fig. 25 for varying excitation amplitudes and a constant damping ratio, demonstrates a slight rightward bend; this is attributed to the positive coefficient of cubic stiffness, indicating a hardening scenario. This bend exemplifies the jump phenomenon’s effect in the model. As the frequency ratio sweeps forward, a sudden drop in amplitude occurs after reaching the peak, denoting the jump-down of amplitude during the forward sweep. Conversely, during the backward sweep, a sudden increase in amplitude is noted, indicating the jump-up phenomenon during the reverse sweep. According to the observations from Fig. 25, both jump-down and jump-up occur within the same frequency ratio range in the proposed model. The area between the jump-up and jump-down is considered unstable, due to the abrupt changes in amplitude that could potentially damage the system. Therefore, it is recommended that the system be designed for a frequency range extending beyond the jump-up and jump-down conditions.

Frequency response curve for varying excitation amplitude and constant damping ratio.
Figure 25 further reveals that with an increase in excitation amplitude, the curve shifts towards a higher frequency range, exhibits more bending, and the peak amplitude also increases. Conversely, a lower excitation amplitude demonstrates a better isolation range, suggesting that a system designed for low excitation amplitude is preferable for enhanced isolation performance. Figure 26 illustrates the frequency response of the system with a constant excitation amplitude and varying damping ratios. It is observed that as the damping decreases, the peak amplitude rises and the curve shifts to a higher frequency range with more pronounced bending. However, at high-frequency ratios, the system shows effective isolation performance across all damping ratios. Thus, the system should ideally be designed for low-excitation amplitude coupled with an optimal damping ratio to achieve superior vibration isolation performance in low-frequency ranges.

Frequency response curve for varying damping ratio and constant excitation amplitude.
Stability response of the system
An abrupt change in the structural response of the system by a small variation in any of its parameters is known as the unstable state of the system. In this section, the unstable region of the proposed model is studied by performing a stability analysis. The Harmonic Balance is used to solve the nonlinear dynamic equation. Therefore, the same will be used to find the steady-state response for the stability analysis. First, a non-dimensional perturbation parameter \(\sigma (\tau )\) is introduced and superimposed into Eq. (42):
Ignoring the terms of order higher than \(O({\sigma }^{2})\) and higher-order harmonics, the equation of motion in non-dimensional perturbation term can be expressed as:
where,
The equation of motion outlined in Eq. (46) is referred to as the damped Mathew’s equation, where \(v\) is a function of \(w\), and the plane \(( v-w )\) is divided into stable and unstable regions by the transition curve. This transition curve is derived by conducting a perturbation analysis. The solution to Eq. (48) delineates the transition curve as a parabolic equation:
The region enclosed by this parabolic curve, illustrated as a shaded area in Fig. 27, represents instability. Observations from Fig. 27 indicate that the unstable region coincides with the bending region of the Frequency Response Function (FRF) curve, where the jump phenomenon is evident. Consequently, the unstable intermediate branch is situated between the jump-up and jump-down frequencies of the frequency response. To enhance system stability, it is advisable to design systems that avoid bending in the FRF curve.

Stability curve for \(\xi =0.05\) and \({y}_{0}=0.05\).
A parametric study has also been conducted to examine how changes in the damping ratio and excitation amplitude affect the behavior of unstable regions. According to the results shown in Fig. 28, increasing the damping leads to a reduction in the unstable region, thereby diminishing the bending and enhancing the system’s stability. Conversely, the stability response of the system appears to be independent of the excitation amplitude, indicating that changes in amplitude do not significantly impact the stability regions.

Parametric study for the unstable regions for varying damping ratios.
Experimental setup
Vibration shaker experiments were conducted to evaluate the dynamic behavior of the proposed model under various payloads. Three distinct payloads were chosen based on the static results displayed in Fig. 20: (i) a mass in the QZS region, identified as QZS payload (185 g), (ii) a lighter payload of 145 g (less than the QZS payload), and (iii) a heavier payload of 225 g (more than the QZS payload). The experimental setup, depicted in Fig. 29, involves the payload being mounted atop the metastructure, which in turn is connected to an electromagnetic shaker via a fixture. Signals are initially generated in the wave generator, subsequently amplified by the power amplifier, and then delivered as input to the shaker. An accelerometer is installed on top of the payload to capture the output signal, while a second accelerometer is affixed to the base plate to record the input signal. Both accelerometers are linked to a data acquisition system that gathers and analyzes the raw signals using T-Vib software. This setup allows for a detailed examination of the metastructure’s response to dynamic loads under different mass conditions.

Experimental setup to study dynamic behavior with metastructure fixed on the top of the shaker.
Vibration isolation performance
The key parameter to assess the vibration performance of the metastructure is the transmissibility response in steady state for specific frequency ranges. In this experimental setup, the base of the metastructure is mounted on the shaker, and base excitation is administered as an input in the form of sinusoidal waves. These waves pass through the metastructure and reach the top, where the output is measured. Under the influence of the payload, the metastructure serves as a vibration isolator. Transmissibility is calculated based on the ratio of time-domain data recorded at the top of the payload to that applied at the bottom for a designated frequency.
The dynamic behavior of the metastructure under a QZS payload is analyzed. A mass of 185 g is mounted on the top of the metastructure to deform it into the QZS region. Input and output acceleration readings are captured from the accelerometers installed on the bottom and top of the metastructure, respectively. The base is excited with a sinusoidal input acceleration represented by \({A}_{0}\text{sin}\omega t\), where \({A}_{0}\) denotes the acceleration amplitude, \(\omega\) the excitation frequency, and \(t\) the time period of the excitation.
The base is subjected to a constant acceleration magnitude while the frequency varies from 5 to 35 Hz. The step size is set at 1 Hz from 5–17 Hz and 19–35 Hz, and at 0.5 Hz between 17 and 19 Hz. Time-domain data are recorded for each frequency, and the root mean square (rms) value of the amplitude is calculated at both input and output. The transmissibility in decibels is then determined by the formula:
Figure 30a–d illustrates the time response for certain frequencies under a QZS payload of 185 gm, where the black dotted line indicates the input and the red solid line represents the output. It is noticeable that at a frequency of 10 Hz, the output magnitude exceeds that of the input. As the frequency increases to 18 Hz, the output amplitude reaches its maximum value. Upon further increment to 18.5 Hz, a sudden drop in the output amplitude is observed, and by the frequency of 25 Hz, the output amplitude significantly reduces compared to the input, demonstrating effective isolation.

The time domain response of QZS region payload (185 gm) for different excitation frequencies.
Based on the time response data obtained, transmissibility is calculated using Eq. (49) and plotted against each frequency in Fig. 31. It is noticeable that as the frequency increases from 5 Hz, the transmissibility correspondingly rises until it reaches a peak value of 9 dB at 18 Hz. With an incremental frequency increase to 18.5 Hz, the transmissibility sharply drops to −4 dB. This sudden change in transmissibility from 9 to −4 dB within a narrow frequency range of 0.5 Hz exemplifies what is technically known as the jump phenomenon. As the frequency continues to increase from 18.5 to 35 Hz, the transmissibility further declines to -13.5 dB, indicating that the isolation range of the metastructure under QZS load begins for frequencies higher than 18.5 Hz.

Transmissibility vs. frequency response of the QZS payload (185 gm).
To explore the jump phenomenon, a sine sweep from 3 to 23 Hz over a period of 20 s was conducted. A forward sweep is utilized to examine the jump-down phenomenon, and a backward sweep is used to analyze the jump-up phenomenon. Observations from Fig. 32a reveal that as the frequency increases, the amplitude also increases until it reaches its peak. With a further rise in frequency, a noticeable jump-down in amplitude occurs; this denotes a rapid transition from the resonance peak to the isolation region. This abrupt decrease in amplitude from 18 to 18.5 Hz is also evident in Fig. 33a. Conversely, during the backward sweep, as shown in Fig. 32b, when the frequency decreases, the amplitude rises, and a sudden jump-up is noted, indicating a swift transition from the isolation region back to a region of higher amplitude. This sudden increase in amplitude from 18.5 to 18 Hz is similarly reflected in Fig. 33b. The overlap of forward and backward sweeps is also depicted in Fig. 32c, illustrating the dynamic shifts in amplitude associated with different sweep directions.

Represents the time vs. amplitude response of the QZS payload under sine sweep from 4 to 23 Hz for 20 s. (a) forward sweep response, (b) backward sweep response. (c) superposition of forward and backward response.

Captured time domain response during the transition of frequency (a) from 18 to 18.5 Hz, (b) from 18.5 to 18 Hz.
Parametric study
Two parametric studies were conducted to experimentally evaluate the dynamic performance of the designed metastructure: (i) under varying payloads mounted on the top of the metastructure and (ii) under varying excitation amplitudes.
Three different payloads are selected based on the force–displacement curve presented in Fig. 20. The first payload, weighing 145 g, is chosen from the positive stiffness region and is lighter than the QZS payload. The second payload, weighing 185 gm, is the QZS payload selected from the QZS region. The third payload, weighing 225 g, is heavier than the QZS payload and is also selected from the positive stiffness region.
In the parametric study involving different payloads, the first and third payloads were mounted on the shaker, and base excitation was applied from the bottom with the same amplitude used for the QZS payload and over the same frequency range. The time response under various frequencies was then recorded and displayed in Fig. 34a–d for the 145 g mass and in Fig. 35a–d for the 225 g mass. Transmissibility was calculated from the RMS values measured at the top and bottom for each frequency and plotted in Fig. 36.

The time domain response of linear stiffness region payload (145 gm) for different excitation frequencies.

The time domain response of linear stiffness region payload (225 gm) for different excitation frequencies.

Parametric study of the transmissibility vs. frequency curve for three different weights. QZS payload mass- 185 gm, Linear stiffness region mass- 145 gm, Linear stiffness region mass- 225 gm.
Figure 36 shows that as the frequency increases, transmissibility also increases for all three payloads. As frequency further increases, the 145 g payload reaches a peak transmissibility of 12 dB at 22.5 Hz, then the transmissibility starts decreasing, and isolation begins at 26.3 Hz. The QZS payload reaches a peak transmissibility of 9 dB at 18 Hz, with isolation starting at 18.5 Hz. The 225 g payload reaches a peak transmissibility of 10.75 dB at 20 Hz, with isolation beginning at 24 Hz. These observations indicate that for linear payload masses, the system exhibits linear behavior. In contrast, for the payload designed in the QZS region, the system shows nonlinear behavior, where effective vibration isolation starts from 18.5 Hz, and resonance occurs at 18 Hz with a peak value of 9 dB, which is the lowest compared to the other two masses. At higher frequencies, the QZS payload demonstrates better isolation performance than the other two masses.
The results of the parametric study, including transmissibility peak value, resonance frequency, and isolation frequency, are plotted in the bar chart of Fig. 37a, Fig. 37b and Fig. 37c respectively. The quantitative comparison is performed based on two cases: (i) vibration performance between two linear stiffness region masses (145 g and 225 g), and (ii) vibration performance between a quasi-zero-stiffness region mass (185 g) and a linear stiffness region mass (225 g). For the first case, it can be observed that the 145 g mass exhibits a higher transmissibility peak value (12 dB) and at a higher resonance frequency (26.3 Hz) than the 225 g mass, which shows a peak of 10.75 dB at 24 Hz; also, the isolation of the 145 g mass starts at a higher frequency compared to the 225 gm. This comparison suggests that both masses behave linearly, and for vibration isolation in a low-frequency range, a heavier mass (i.e., 225 g) is preferable. For the second case, the 185 g mass shows a lower transmissibility peak value (9 dB) and at a lower resonance frequency (18 Hz) than the 225 g mass, which exhibits a peak of 10.75 dB at 24 Hz; also, the isolation of the 185 g mass starts at a lower frequency compared to the 225 g mass. This comparison does not follow a linear trend, and for vibration isolation in the low-frequency range, a lower mass (185 g-QZS payload) is appropriate. These comparisons validate that the proposed metastructure exhibits nonlinear behavior and can effectively isolate vibrations at low-frequency ranges when designed for the QZS payload.

Qualitative comparison of the vibration performance of three different payloads achieved experimentally, (i) transmissibility peak value, (ii) resonance frequency, (iii) isolation region starts.
For the parametric study focusing on different excitation amplitudes, the payloads are mounted on the shaker, and their transmissibility was calculated for two distinct excitation amplitudes, with results plotted against the frequency in Fig. 38. Observations from Fig. 38a reveal that the QZS payload displays nonlinear behavior (jump phenomenon) under both high and low amplitude excitations. Notably, lower excitation amplitude results in superior isolation performance at lower frequencies. However, at higher frequency ranges, similar isolation performance is noted across both excitation amplitudes. Conversely, for the other two masses, as depicted in Fig. 38b, c, low amplitude excitation provides better isolation performance at lower frequencies, while high amplitude excitation yields improved isolation performance at higher frequencies, indicating that these payloads behave linearly.

Parametric study of transmissibility vs. frequency curve under low and high excitation amplitude for three different masses- (a) QZS payload mass- 185 gm, (b) Linear stiffness region mass- 145 gm, (c) Linear stiffness region mass- 225 gm.
The dynamic study highlights that the developed metastructure exhibits nonlinear behavior (jump phenomenon) within the QZS region and achieves better isolation performance, lower peak values, and lower resonance frequencies with the QZS payload compared to the other payloads. This distinction proves the unique capabilities of the QZS design in enhancing vibrational isolation, particularly in scenarios where minimizing the transmission of vibrations is critical.
Conclusions
In this study, a vibration isolator is designed to exhibit Quasi-Zero-Stiffness (QZS) characteristics, with its static and dynamic performances investigated analytically and subsequently validated using experimental results. The metastructure is conceived based on the High Static and Low Dynamic Stiffness (HSLDS) mechanism, integrating elements of negative stiffness with those of positive stiffness. The architecture of the proposed metastructure comprises four unit cells arranged in parallel, where each unit cell consists of inclined beams and semicircular arches. Under vertical compression, the inclined beams exhibit negative stiffness as they undergo buckling and snap-through behaviors, while the semicircular arches, undergoing bending-dominated behavior, provide positive stiffness to counterbalance the negative effects and achieve the QZS characteristics.
The design procedure of the inclined beams and arches was analyzed by considering large deformation scenarios to assess the buckling behavior of the beams, and the parameters for the semicircular arches were tailored based on the derived negative stiffness. Subsequently, samples were fabricated using 3D printing techniques. The static behaviors of the inclined beam, unit cell, and the entire metastructure were thoroughly investigated using analytical and numerical methods via ANSYS® software, and these findings were verified by laboratory tests. Moreover, the multiple loading cycle effect to analyze the fatigue life behavior of proposed metastructure is considered as a future scope of the work.
Building upon the static findings, the dynamic performance of the metastructure was investigated. An approximate nonlinear dynamic equation was formulated via curve fitting and solved using the Harmonic Balance method to describe the frequency response curve under varying frequency ratios. Vibration shaker experiments were conducted to assess the performance of the metastructure when loaded with the QZS payload. The transmissibility curve showed a jump-down phenomenon, confirming the nonlinear behavior of the proposed model. A comprehensive parametric study was carried out to evaluate the transmissibility behavior under three distinct payloads and various excitation amplitudes.
From the analytical, numerical, and experimental studies, it was shown that the proposed model not only represents QZS characteristics but also delivers effective vibration isolation performance, particularly within low-frequency ranges. This demonstrates the metastructure’s capability to mitigate vibrational impacts through innovative design and strategic material utilization, hence, establishing its potential applicability in practical engineering solutions where vibration isolation is critical.
Data availability
The datasets generated during and/or analyzed during the current study are available from the corresponding author on reasonable request.
References
Preumont, A. Vibration Control of Active Structures. Springer, Cham (2018). https://doi.org/10.1007/978-3-319-72296-2
Carta, G., Movchan, A. B., Argani, L. P. & Bursi, O. S. Quasi-periodicity and multi-scale resonators for the reduction of seismic vibrations in fluid-solid systems. Int. J. Eng. Sci. 109, 216–239. https://doi.org/10.1016/j.ijengsci.2016.09.010 (2016).
Hou, W., Chang, J., Wang, Y., Kong, C. & Bao, W. Experimental study on the forced oscillation of shock train in an isolator with background waves. Aerosp. Sci. Technol. 106, 106129. https://doi.org/10.1016/j.ast.2020.106129 (2020).
Lee, W. B., Cheung, C. F. & To, S. Materials induced vibration in ultra-precision machining. J. Mater. Process. Technol. 89–90, 318–325. https://doi.org/10.1016/S0924-0136(99)00146-6 (1999).
Rakheja, S., Wu, J. Z., Dong, R. G., Schopper, A. W. & Boileau, P. É. Comparison of biodynamic models of the human hand-arm system for applications to hand-held power tools. J. Sound Vib. 249, 55–82. https://doi.org/10.1006/jsvi.2001.3831 (2002).
Jiao, X., Zhang, J., Yan, Y. & Zhao, H. Research on nonlinear stiffness and damping of bellows-type fluid viscous damper. Nonlinear Dyn. 103, 215–237. https://doi.org/10.1007/s11071-020-06146-9 (2021).
Gatti, G. Optimizing elastic potential energy via geometric nonlinear stiffness. Commun. Nonlinear Sci. Numer. Simul. 103, 106035. https://doi.org/10.1016/j.cnsns.2021.106035 (2021).
Virgin, L. N., Santillan, S. T. & Plaut, R. H. Vibration isolation using extreme geometric nonlinearity. J. Sound Vib. 315, 721–731. https://doi.org/10.1016/j.jsv.2007.12.025 (2008).
Sun, J., Huang, X., Liu, X., Xiao, F. & Hua, H. Study on the force transmissibility of vibration isolators with geometric nonlinear damping. Nonlinear Dyn. 74, 1103–1112. https://doi.org/10.1007/s11071-013-1027-0 (2013).
Wang, S., Zhang, Y., Guo, W., Pi, T. & Li, X. Vibration analysis of nonlinear damping systems by the discrete incremental harmonic balance method. Nonlinear Dyn. 111, 2009–2028. https://doi.org/10.1007/s11071-022-07953-y (2023).
Bian, J. & Jing, X. Superior nonlinear passive damping characteristics of the bio-inspired limb-like or X-shaped structure. Mech. Syst. Signal Process. 125, 21–51. https://doi.org/10.1016/j.ymssp.2018.02.014 (2019).
Balaji, P. S. & Karthik SelvaKumar, K. Applications of nonlinearity in passive vibration control: a review. J. Vib. Eng. Technol. 9, 183–213. https://doi.org/10.1007/s42417-020-00216-3 (2021).
Dalela, S., Balaji, P. S. & Jena, D. P. A review on application of mechanical metamaterials for vibration control. Mech. Adv. Mater. Struct. 29, 3237–3262. https://doi.org/10.1080/15376494.2021.1892244 (2022).
Ibrahim, R. A. Recent advances in nonlinear passive vibration isolators. J. Sound Vib. 314, 371–452. https://doi.org/10.1016/j.jsv.2008.01.014 (2008).
Wang, K. et al. A nonlinear ultra-low-frequency vibration isolator with dual quasi-zero-stiffness mechanism. Nonlinear Dyn. 101, 755–773. https://doi.org/10.1007/s11071-020-05806-0 (2020).
Dalela, S., Balaji, P. S. & Jena, D. P. Design of a metastructure for vibration isolation with quasi-zero-stiffness characteristics using bistable curved beam. Nonlinear Dyn. 108, 1931–1971. https://doi.org/10.1007/s11071-022-07301-0 (2022).
Ding, H. & Chen, L. Q. Nonlinear vibration of a slightly curved beam with quasi-zero-stiffness isolators. Nonlinear Dyn. 95, 2367–2382. https://doi.org/10.1007/s11071-018-4697-9 (2019).
Huang, X., Liu, X. & Hua, H. On the characteristics of an ultra-low frequency nonlinear isolator using sliding beam as negative stiffness. J. Mech. Sci. Technol. 28, 813–822. https://doi.org/10.1007/s12206-013-1205-5 (2014).
Fulcher, B. A., Shahan, D. W., Haberman, M. R., Seepersad, C. C. & Wilson, P. S. Analytical and experimental investigation of buckled beams as negative stiffness elements for passive vibration and shock isolation systems. J. Vib. Acoust. Trans. ASME https://doi.org/10.1115/1.4026888 (2014).
Liu, C. & Yu, K. Accurate modeling and analysis of a typical nonlinear vibration isolator with quasi-zero stiffness. Nonlinear Dyn. 100, 2141–2165. https://doi.org/10.1007/s11071-020-05642-2 (2020).
Kovacic, I., Brennan, M. J. & Waters, T. P. A study of a nonlinear vibration isolator with a quasi-zero stiffness characteristic. J. Sound Vib. 315, 700–711. https://doi.org/10.1016/j.jsv.2007.12.019 (2008).
Bouna, H. S., Nbendjo, B. R. N. & Woafo, P. Isolation performance of a quasi-zero stiffness isolator in vibration isolation of a multi-span continuous beam bridge under pier base vibrating excitation. Nonlinear Dyn. 100, 1125–1141. https://doi.org/10.1007/s11071-020-05580-z (2020).
Liu, C. & Yu, K. Design and experimental study of a quasi-zero-stiffness vibration isolator incorporating transverse groove springs. Arch. Civ. Mech. Eng. 20, 67. https://doi.org/10.1007/s43452-020-00069-3 (2020).
Zhao, F., Ji, J., Ye, K. & Luo, Q. An innovative quasi-zero stiffness isolator with three pairs of oblique springs. Int. J. Mech. Sci. 192, 106093. https://doi.org/10.1016/j.ijmecsci.2020.106093 (2021).
Lan, C. C., Yang, S. A. & Wu, Y. S. Design and experiment of a compact quasi-zero-stiffness isolator capable of a wide range of loads. J. Sound Vib. 333, 4843–4858. https://doi.org/10.1016/j.jsv.2014.05.009 (2014).
Zhao, F., Ji, J. C., Ye, K. & Luo, Q. Increase of quasi-zero stiffness region using two pairs of oblique springs. Mech. Syst. Signal Process. 144, 106975. https://doi.org/10.1016/j.ymssp.2020.106975 (2020).
Sun, X., Wang, F. & Xu, J. Analysis, design and experiment of continuous isolation structure with Local Quasi-Zero-Stiffness property by magnetic interaction. Int. J. Non. Linear. Mech. 116, 289–301. https://doi.org/10.1016/j.ijnonlinmec.2019.07.008 (2019).
Zhou, Y., Chen, P. & Mosqueda, G. Analytical and numerical investigation of quasi-zero stiffness vertical isolation system. J. Eng. Mech. https://doi.org/10.1061/(asce)em.1943-7889.0001611 (2019).
Wang, L. et al. Ultra-low frequency vibration control of urban rail transit: the general quasi-zero-stiffness vibration isolator. Veh. Syst. Dyn. 60, 1788–1805. https://doi.org/10.1080/00423114.2021.1874428 (2022).
Deng, Z. & Dapino, M. J. Review of magnetostrictive materials for structural vibration control. Smart Mater. Struct. 27, 113001. https://doi.org/10.1088/1361-665X/aadff5 (2018).
Wang, K., Zhou, J., Wang, Q., Ouyang, H. & Xu, D. Low-frequency band gaps in a metamaterial rod by negative-stiffness mechanisms: Design and experimental validation. Appl. Phys. Lett. 114, 251902. https://doi.org/10.1063/1.5099425 (2019).
Li, M., Cheng, W. & Xie, R. Design and experiments of a quasi–zero-stiffness isolator with a noncircular cam-based negative-stiffness mechanism, JVC/Journal Vib. Control 26, 1935–1947. https://doi.org/10.1177/1077546320908689 (2020).
Li, M., Cheng, W. & Xie, R. A quasi-zero-stiffness vibration isolator using a cam mechanism with user-defined profile. Int. J. Mech. Sci. 189, 105938. https://doi.org/10.1016/j.ijmecsci.2020.105938 (2021).
Zhou, J., Wang, X., Xu, D. & Bishop, S. Nonlinear dynamic characteristics of a quasi-zero stiffness vibration isolator with cam-roller-spring mechanisms. J. Sound Vib. 346, 53–69. https://doi.org/10.1016/j.jsv.2015.02.005 (2015).
Wang, F., Sun, X., Meng, H. & Xu, J. Tunable broadband low-frequency band gap of multiple-layer metastructure induced by time-delayed vibration absorbers. Nonlinear Dyn. 107, 1903–1918. https://doi.org/10.1007/s11071-021-07065-z (2022).
Liu, S., Peng, G. & Jin, K. Design and characteristics of a novel QZS vibration isolation system with origami-inspired corrector. Nonlinear Dyn. 106, 255–277. https://doi.org/10.1007/s11071-021-06821-5 (2021).
Zhou, J., Pan, H., Cai, C. & Xu, D. Tunable ultralow frequency wave attenuations in one-dimensional quasi-zero-stiffness metamaterial. Int. J. Mech. Mater. Des. 17, 285–300. https://doi.org/10.1007/s10999-020-09525-7 (2021).
Ji, J. C., Luo, Q. & Ye, K. Vibration control based metamaterials and origami structures: A state-of-the-art review. Mech. Syst. Signal Process. 161, 107945. https://doi.org/10.1016/j.ymssp.2021.107945 (2021).
Cai, C. et al. Design and numerical validation of quasi-zero-stiffness metamaterials for very low-frequency band gaps. Compos. Struct. 236, 111862. https://doi.org/10.1016/j.compstruct.2020.111862 (2020).
Meng, L., Sun, J. & Wu, W. Theoretical design and characteristics analysis of a quasi-zero stiffness isolator using a disk spring as negative stiffness element. Shock Vib. 2015, 1–19. https://doi.org/10.1155/2015/813763 (2015).
Feng, X. & Jing, X. Human body inspired vibration isolation: Beneficial nonlinear stiffness, nonlinear damping & nonlinear inertia. Mech. Syst. Signal Process. 117, 786–812. https://doi.org/10.1016/j.ymssp.2018.08.040 (2019).
Sun, X., Jing, X., Xu, J. & Cheng, L. Vibration isolation via a scissor-like structured platform. J. Sound Vib. 333, 2404–2420. https://doi.org/10.1016/j.jsv.2013.12.025 (2014).
Wu, Z., Jing, X., Sun, B. & Li, F. A 6DOF passive vibration isolator using X-shape supporting structures. J. Sound Vib. 380, 90–111. https://doi.org/10.1016/j.jsv.2016.06.004 (2016).
Vo, N. Y. P. & Le, T. D. Dynamic analysis of quasi-zero stiffness pneumatic vibration isolator. Appl. Sci. 12, 2378. https://doi.org/10.3390/app12052378 (2022).
Palomares, E., Nieto, A. J., Morales, A. L., Chicharro, J. M. & Pintado, P. Numerical and experimental analysis of a vibration isolator equipped with a negative stiffness system. J. Sound Vib. 414, 31–42. https://doi.org/10.1016/j.jsv.2017.11.006 (2018).
Carrella, A., Brennan, M. J. & Waters, T. P. Static analysis of a passive vibration isolator with quasi-zero-stiffness characteristic. J. Sound Vib. 301, 678–689. https://doi.org/10.1016/j.jsv.2006.10.011 (2007).
Carrella, A., Brennan, M. J., Kovacic, I. & Waters, T. P. On the force transmissibility of a vibration isolator with quasi-zero-stiffness. J. Sound Vib. 322, 707–717. https://doi.org/10.1016/j.jsv.2008.11.034 (2009).
Carrella, A., Brennan, M. J., Waters, T. P. & Lopes, V. Force and displacement transmissibility of a nonlinear isolator with high-static-low-dynamic-stiffness. Int. J. Mech. Sci. 55, 22–29. https://doi.org/10.1016/j.ijmecsci.2011.11.012 (2012).
Gatti, G. Statics and dynamics of a nonlinear oscillator with quasi-zero stiffness behaviour for large deflections. Commun. Nonlinear Sci. Numer. Simul. 83, 105143. https://doi.org/10.1016/j.cnsns.2019.105143 (2020).
Le, T. D. & Ahn, K. K. Experimental investigation of a vibration isolation system using negative stiffness structure. Int. J. Mech. Sci. 70, 99–112. https://doi.org/10.1016/j.ijmecsci.2013.02.009 (2013).
Huang, X., Liu, X., Sun, J., Zhang, Z. & Hua, H. Vibration isolation characteristics of a nonlinear isolator using euler buckled beam as negative stiffness corrector: A theoretical and experimental study. J. Sound Vib. 333, 1132–1148. https://doi.org/10.1016/j.jsv.2013.10.026 (2014).
Huang, X., Chen, Y., Hua, H., Liu, X. & Zhang, Z. Shock isolation performance of a nonlinear isolator using Euler buckled beam as negative stiffness corrector: Theoretical and experimental study. J. Sound Vib. 345, 178–196. https://doi.org/10.1016/j.jsv.2015.02.001 (2015).
Shaw, A. D., Gatti, G., Gonçalves, P. J. P., Tang, B. & Brennan, M. J. Design and test of an adjustable quasi-zero stiffness device and its use to suspend masses on a multi-modal structure. Mech. Syst. Signal Process. 152, 107354. https://doi.org/10.1016/j.ymssp.2020.107354 (2021).
Sun, X. & Jing, X. Multi-direction vibration isolation with quasi-zero stiffness by employing geometrical nonlinearity. Mech. Syst. Signal Process. 62, 149–163. https://doi.org/10.1016/j.ymssp.2015.01.026 (2015).
Cheng, C., Li, S., Wang, Y. & Jiang, X. Force and displacement transmissibility of a quasi-zero stiffness vibration isolator with geometric nonlinear damping. Nonlinear Dyn. 87, 2267–2279. https://doi.org/10.1007/s11071-016-3188-0 (2017).
Lu, Z. Q., Brennan, M., Ding, H. & Chen, L. Q. High-static-low-dynamic-stiffness vibration isolation enhanced by damping nonlinearity. Sci. China Technol. Sci. 62, 1103–1110. https://doi.org/10.1007/s11431-017-9281-9 (2019).
Zhou, J., Wang, K., Xu, D., Ouyang, H. & Fu, Y. Vibration isolation in neonatal transport by using a quasi-zero-stiffness isolator. JVC/J. Vib Control 24, 3278–3291. https://doi.org/10.1177/1077546317703866 (2018).
Zheng, Y., Li, Q., Yan, B., Luo, Y. & Zhang, X. A Stewart isolator with high-static-low-dynamic stiffness struts based on negative stiffness magnetic springs. J. Sound Vib. 422, 390–408. https://doi.org/10.1016/j.jsv.2018.02.046 (2018).
Wang, S., Xin, W., Ning, Y., Li, B. & Hu, Y. Design, experiment, and improvement of a quasi-zero-stiffness vibration isolation system. Appl. Sci. 10, 2273. https://doi.org/10.3390/app10072273 (2020).
Zhao, J. et al. A novel electromagnet-based absolute displacement sensor with approximately linear quasi-zero-stiffness. Int. J. Mech. Sci. 181, 105695. https://doi.org/10.1016/j.ijmecsci.2020.105695 (2020).
Yuan, S. et al. A tunable quasi-zero stiffness isolator based on a linear electromagnetic spring. J. Sound Vib. 482, 115449. https://doi.org/10.1016/j.jsv.2020.115449 (2020).
Vo, N. Y. P., Nguyen, M. K. & Le, T. D. Analytical study of a pneumatic vibration isolation platform featuring adjustable stiffness. Commun. Nonlinear Sci. Numer. Simul. 98, 105775. https://doi.org/10.1016/j.cnsns.2021.105775 (2021).
López-Martínez, J., García-Vallejo, D., Arrabal-Campos, F. M. & Garcia-Manrique, J. M. Design of three new cam-based constant-force mechanisms. J. Mech. Des. Trans. ASME https://doi.org/10.1115/1.4040174 (2018).
Ye, K., Ji, J. C. & Brown, T. A novel integrated quasi-zero stiffness vibration isolator for coupled translational and rotational vibrations. Mech. Syst. Signal Process. 149, 107340. https://doi.org/10.1016/j.ymssp.2020.107340 (2021).
Liu, S., Peng, G., Li, Z., Li, W. & Sun, L. Low-frequency vibration isolation via an elastic origami-inspired structure. Int. J. Mech. Sci. 260, 108622. https://doi.org/10.1016/j.ijmecsci.2023.108622 (2023).
Ye, K. & Ji, J. C. An origami inspired quasi-zero stiffness vibration isolator using a novel truss-spring based stack Miura-ori structure. Mech. Syst. Signal Process. 165, 108383. https://doi.org/10.1016/j.ymssp.2021.108383 (2022).
Zeng, P., Yang, Y., Huang, L., Yin, L. & Liu, B. An origami-inspired quasi-zero stiffness structure for low-frequency vibration isolation. J. Vib. Eng. Technol. 11, 1463–1475. https://doi.org/10.1007/s42417-022-00651-4 (2023).
Liu, W., Wu, L., Sun, J. & Zhou, J. Origami-inspired quasi-zero stiffness metamaterials for low-frequency multi-direction vibration isolation. Appl. Phys. Lett. https://doi.org/10.1063/5.0164777 (2023).
Niu, M. Q. & Chen, L. Q. Analysis of a bio-inspired vibration isolator with a compliant limb-like structure. Mech. Syst. Signal Process. 179, 109348. https://doi.org/10.1016/j.ymssp.2022.109348 (2022).
Han, W. J., Lu, Z. Q., Niu, M. Q. & Chen, L. Q. Analytical and experimental investigation on a NiTiNOL circular ring-type vibration isolator with both stiffness and damping nonlinearities. J. Sound Vib. 547, 117543. https://doi.org/10.1016/j.jsv.2022.117543 (2023).
Zhang, Q., Guo, D. & Hu, G. Tailored mechanical metamaterials with programmable quasi-zero-stiffness features for full-band vibration isolation. Adv. Funct. Mater. 31, 2101428. https://doi.org/10.1002/adfm.202101428 (2021).
Liu, C. H., Hsu, M. C., Chen, T. L. & Chen, Y. Optimal design of a compliant constant-force mechanism to deliver a nearly constant output force over a range of input displacements. Soft Robot. 7, 758–769. https://doi.org/10.1089/soro.2019.0122 (2020).
Guo, L., Wang, X., Fan, R. L. & Bi, F. Review on development of high-static-low-dynamic-stiffness seat cushion mattress for vibration control of seating suspension system. Appl. Sci. 10, 2887. https://doi.org/10.3390/APP10082887 (2020).
Liu, C. et al. Nonlinear dynamics of a magnetic vibration isolator with higher-order stable quasi-zero-stiffness. Mech. Syst. Signal Process. 218, 111584. https://doi.org/10.1016/j.ymssp.2024.111584 (2024).
Liu, C., Zhao, R., Yu, K. & Liao, B. In-plane quasi-zero-stiffness vibration isolator using magnetic interaction and cables: Theoretical and experimental study. Appl. Math. Model. 96, 497–522. https://doi.org/10.1016/j.apm.2021.03.035 (2021).
Yan, B., Yu, N. & Wu, C. A state-of-the-art review on low-frequency nonlinear vibration isolation with electromagnetic mechanisms. Appl. Math. Mech. (English Ed.) 43, 1045–1062. https://doi.org/10.1007/s10483-022-2868-5 (2022).
Kamaruzaman, N. A., Robertson, W. S. P., Ghayesh, M. H., Cazzolato, B. S. & Zander, A. C. Six degree of freedom quasi-zero stiffness magnetic spring with active control: Theoretical analysis of passive versus active stability for vibration isolation. J. Sound Vib. https://doi.org/10.1016/j.jsv.2021.116086 (2021).
Zhao, F., Ji, J. C., Cao, S., Ye, K. & Luo, Q. QZS isolators with multi-pairs of oblique bars for isolating ultralow frequency vibrations. Nonlinear Dyn. 112, 1815–1842. https://doi.org/10.1007/s11071-023-09160-9 (2024).
Zheng, Y., Bin Shangguan, W., Yin, Z. & Liu, X. A. Design and modeling of a quasi-zero stiffness isolator for different loads. Mech. Syst. Signal Process. https://doi.org/10.1016/j.ymssp.2022.110017 (2023).
Kim, K. R., Han You, Y. & Ahn, H. J. Optimal design of a QZS isolator using flexures for a wide range of payload. Int. J. Precis. Eng. Manuf. 14, 911–917. https://doi.org/10.1007/s12541-013-0120-0 (2013).
Liu, L., Chai, Y., Guo, Z. & Li, M. A novel isolation system with enhanced QZS properties for supporting multiple loads. Aerosp. Sci. Technol. 143, 108719. https://doi.org/10.1016/j.ast.2023.108719 (2023).
Liu, C., Zhang, W., Yu, K., Liu, T. & Zheng, Y. Quasi-zero-stiffness vibration isolation: Designs, improvements and applications. Eng. Struct. 301, 117282. https://doi.org/10.1016/j.engstruct.2023.117282 (2024).
Barchiesi, E., Spagnuolo, M. & Placidi, L. Mechanical metamaterials: a state of the art. Math. Mech. Solids 24, 212–234. https://doi.org/10.1177/1081286517735695 (2019).
Frenzel, T., Findeisen, C., Kadic, M., Gumbsch, P. & Wegener, M. Tailored buckling microlattices as reusable light-weight shock absorbers. Adv. Mater. 28, 5865–5870. https://doi.org/10.1002/adma.201600610 (2016).
Tan, X. et al. Reusable metamaterial via inelastic instability for energy absorption. Int. J. Mech. Sci. 155, 509–517. https://doi.org/10.1016/j.ijmecsci.2019.02.011 (2019).
Ha, C. S., Lakes, R. S. & Plesha, M. E. Design, fabrication, and analysis of lattice exhibiting energy absorption via snap-through behavior. Mater. Des. 141, 426–437. https://doi.org/10.1016/j.matdes.2017.12.050 (2018).
Zhao, J., Jia, N., He, X. & Wang, H. Post-buckling and snap-through behavior of inclined slender beams. J. Appl. Mech. Trans. ASME 75, 0410201–0410207. https://doi.org/10.1115/1.2870953 (2008).
Howell, L. L. Compliant Mechanisms (2001).
Masters, N. D. & Howell, L. L. A self-retracting fully compliant bistable micromechanism. J. Microelectromech. Syst. 12, 273–280. https://doi.org/10.1109/JMEMS.2003.811751 (2003).
Kim, C. & Ebenstein, D. Curve decomposition for large deflection analysis of fixed-guided beams with application to statically balanced compliant mechanisms. J. Mech. Robot. https://doi.org/10.1115/1.4007488 (2012).
Holst, G. L., Teichert, G. H. & Jensen, B. D. Modeling and experiments of buckling modes and deflection of fixed-guided beams in compliant mechanisms. J. Mech. Des. Trans. ASME https://doi.org/10.1115/1.4003922 (2011).
Ma, F. & Chen, G. Modeling large planar deflections of flexible beams in compliant mechanisms using chained beam-constraint-model. J. Mech. Robot. 8, 55. https://doi.org/10.1115/1.4031028 (2016).
Chase, R. P., Todd, R. H., Howell, L. L. & Magleby, S. P. A 3-D chain algorithm with pseudo-rigid-body model elements. Mech. Based Des. Struct. Mach. 39, 142–156. https://doi.org/10.1080/15397734.2011.541783 (2011).
Zhou, Z., Gao, Y., Sun, L., Dong, W. & Du, Z. A bistable mechanism with linear negative stiffness and large in-plane lateral stiffness: Design, modeling and case studies. Mech. Sci. 11, 75–89. https://doi.org/10.5194/ms-11-75-2020 (2020).
Li, Y., Tijjani, M. Z., Jiang, X. & Ahmed, J. O. Band gap mechanism and vibration attenuation of a quasi-zero stiffness metastructure. Int. J. Struct. Integr. 13, 1041–1059. https://doi.org/10.1108/IJSI-08-2022-0104 (2022).
Fan, H., Yang, L., Tian, Y. & Wang, Z. Design of metastructures with quasi-zero dynamic stiffness for vibration isolation. Compos. Struct. 243, 112244. https://doi.org/10.1016/j.compstruct.2020.112244 (2020).
Peng, Z. K., Lang, Z. Q., Billings, S. A. & Tomlinson, G. R. Comparisons between harmonic balance and nonlinear output frequency response function in nonlinear system analysis. J. Sound Vib. 311, 56–73. https://doi.org/10.1016/j.jsv.2007.08.035 (2008).
Carrella, A. Passive vibration isolators with high-static-low-dynamic-stiffness, University of Southampton, 2008. https://eprints.soton.ac.uk/51276/.
Brennan, M. J., Kovacic, I., Carrella, A. & Waters, T. P. On the jump-up and jump-down frequencies of the Duffing oscillator. J. Sound Vib. 318, 1250–1261. https://doi.org/10.1016/j.jsv.2008.04.032 (2008).
Acknowledgements
The author would like to thank the Department of Mechanical Engineering, National Institute of Technology Rourkela, for extending the facilities for this research. The authors are also thankful to the Dean of Scientific Research at King Khalid University and to the University of Sharjah.
Funding
This work is jointly supported by SERB, Department of Science and Technology, Govt. of India, under core research grant CRG/2021/002660 and by Dean of Scientific Research King Khalid University under grant number RGP2/345/45. Additional support was provided by the University of Sharjah, United Arab Emirates.
Author information
Authors and Affiliations
Contributions
S.D: Conceptualization, Investigation, Validation, Software, Data curation, Writing—original draft. P.S. B.: Methodology, Formal analysis, Writing—review & editing, Supervision, Project administration, Funding acquisition. M. L.: Funding acquisition; Writing—review and editing. S.V. and A.K. review ; Funding acquisition.
Corresponding author
Ethics declarations
Competing interests
The authors declare no competing interests.
Additional information
Publisher's note
Springer Nature remains neutral with regard to jurisdictional claims in published maps and institutional affiliations.
Rights and permissions
Open Access This article is licensed under a Creative Commons Attribution-NonCommercial-NoDerivatives 4.0 International License, which permits any non-commercial use, sharing, distribution and reproduction in any medium or format, as long as you give appropriate credit to the original author(s) and the source, provide a link to the Creative Commons licence, and indicate if you modified the licensed material. You do not have permission under this licence to share adapted material derived from this article or parts of it. The images or other third party material in this article are included in the article’s Creative Commons licence, unless indicated otherwise in a credit line to the material. If material is not included in the article’s Creative Commons licence and your intended use is not permitted by statutory regulation or exceeds the permitted use, you will need to obtain permission directly from the copyright holder. To view a copy of this licence, visit http://creativecommons.org/licenses/by-nc-nd/4.0/.
About this article

Cite this article
Dalela, S., Balaji, P.S., Leblouba, M. et al. Nonlinear static and dynamic response of a metastructure exhibiting quasi-zero-stiffness characteristics for vibration control: an experimental validation. Sci Rep 14, 19195 (2024). https://doi.org/10.1038/s41598-024-70126-x
Received:
Accepted:
Published:
DOI: https://doi.org/10.1038/s41598-024-70126-x
- Springer Nature Limited