
Abstract
Chemodynamic therapy represents a novel tumor therapeutic modality via triggering catalytic reactions in tumors to yield highly toxic reactive oxygen species (ROS). Nevertheless, low efficiency catalytic ability, potential systemic toxicity and inefficient tumor targeting, have hindered the efficacy of chemodynamic therapy. Herein, a rationally designed catalytic nanoplatform, composed of folate acid conjugated liposomes loaded with copper peroxide (CP) and chloroquine (CQ; a clinical drug) (denoted as CC@LPF), could power maximal tumor cytotoxicity, mechanistically via maneuvering endogenous and exogenous copper for a highly efficient catalytic reaction. Despite a massive autophagosome accumulation elicited by CP-powered autophagic initiation and CQ-induced autolysosomal blockage, the robust ROS, but not aberrant autophagy, underlies the synergistic tumor inhibition. Otherwise, this combined mode also elicits an early onset, above all, long-term high-level existence of immunogenic cell death markers, associated with ROS and aberrant autophagy -triggered endoplasmic reticulum stress. Besides, CC@LPF, with tumor targeting capability and selective tumor cytotoxicity, could elicit intratumor dendritic cells (mainly attributed to CQ) and tumor infiltrating CD8+ T cells, upon combining with PD-L1 therapeutic antibody, further induce significant anti-tumor effect. Collectively, the rationally designed nanoplatform, CC@LPF, could enhance tumor chemoimmunotherapy via deploying endogenous plus exogenous copper and remodeling tumor microenvironment.
Graphical abstract

Introduction
In addition to enhancing the direct killing effect on tumor cells, increasing the immunogenicity and adjuvanticity of the local tumor microenvironment and inducing a persistent and effective immune response are considered an effective strategy for tumor treatment, underlying a theoretical foundation for the combined application of chemotherapy and immunotherapy. Immunogenic cell death (ICD) is one kind of stress-induced regulated cell death that can drive the body’s inflammatory response, ultimately activate adaptive immunity driven by cytotoxic T lymphocytes (CTLs) and establishing long-term immune memory [1, 2]. When cells undergoing ICD, dying cells would produce new antigenic epitopes and damage associated molecular patterns (DAMPs). Antigen presenting cells can then recognize plus process antigens, and, by virtue of major histocompatibility complex, present them to T cells to activate adaptive immune responses [1, 2]. Certain chemotherapeutic drugs have the ability to induce ICD effect and activate anti-tumor immunity [3,4,5]. Several biochemical features related to ICD have been determined, including the extracellular release of high mobility group box B1 (HMGB1) and adenosine 5’-triphosphate (ATP), the exposure of calreticulin (CRT) on the dying cell membrane, etc [1, 2]. The ‘ integrated stress response’ (ISR) is derived from the phosphorylation of eukaryotic translation initiation factor 2 subunit alpha (eIF2α) [6]. Compared to cytotoxic drugs that can not induce ICD effects, most methods of inducing ICD effects can effectively stimulate eIF2α phosphorylation, which is considered as another important marker of ICD [7]. However, the successful induction of ICD for tumor therapy not only lies on the antigenicity and adjuvanticity from the dying cells, but also depends on the tumor micro-environmental conditions. There are many possible mechanisms influencing ICD and promoting tumor immune escape, including but not limited to (1) insufficient tumor infiltration of APCs; (3) inhibition of APC activity by immunosuppressive cytokines; (2) unsuccessful antigen presentation due to the co-inhibitory factors (such as CTLA4) expressed by tumor infiltrating T cells; (4) immunosuppressive effects mediated by adenosine converted from ATP; (5) the redox status of DAMPs; (6) insufficient tumor infiltration of CTLs; (7) dysfunction of tumor-infiltrating T cells, etc [1, 8]. Hence, the powerful immunosuppressive mechanisms established in the tumor microenvironment may hinder the execution of ICD, helping tumor cells achieve immune escape.
Tumor immunotherapy represents a strategy for controlling and clearing tumors via boosting the tumor immune cycle and reinvigorating the body’s anti-tumor immune response. Several categories of immunotherapy applied for tumor treatment includes immune checkpoint blockade (ICB) therapy, therapeutic antibodies, cancer vaccines, adoptive cell transfer therapy, etc. [9]. Therein, ICB is to deploy engineered monoclonal antibodies to relieve immune suppression caused by immune checkpoints utilized by tumor cells, and reactivate immune cells to exert anti-tumor effects. At present, ICB represented by PD-1/PD-L1 or CTLA-4 blockade has been widely used in the clinical treatment of various advanced solid tumors, representing a forefront of tumor immunotherapy [10]. However, the therapeutic failures in a large portion of patients, the potential drug resistance issues and toxicity remain the main reasons limiting the popularization of mono-ICB therapy [11,12,13]. One of the main evidences of low response to ICB treatment is poor immunogenicity of the tumor micro-environment [14]. Considering that only a small proportion of patients can benefit from ICB, in order to improve clinical response of ICB therapy, the combined therapeutic modes between ICB and traditional tumor therapy (chemotherapy, radiotherapy, etc.) or novel immunomodulatory therapies have been widely explored [12, 15, 16]. Among them, enhancing tumor cell ICD showcases the potent for optimizing the therapeutic potential of ICB, indicating a crucial direction for combination therapies [8, 12, 15].
Tumor chemodynamic therapy (CDT) make use of Fenton or Fenton-like reactions to produce a large number of hydroxyl radicals (∙OH), thereby killing tumor cells [17]. Metal ions with Fenton effect can promote hydrogen peroxide (H2O2) to catalyze the formation of hydroxyl radical (∙OH), and induce tumor cell apoptosis and necrosis. Among these, iron-based nanomaterials have been widely reported to be used for chemical dynamic treatment of tumors. Iron based nanomaterials mainly utilize the Fenton reaction mediated by excessive ferrous ions to yield highly toxic ∙OH from H2O2. Magnetic iron oxide nanoparticles have gained widespread attention because of their biological safety and excellent magnetic resonance imaging performance [18]. Later research found that the Fenton reaction catalyzed by magnetic iron oxide only occurs under high acidic conditions (pH 2 ~ 4), and ferrous ions are easily oxidized in the air or biological system, especially in the blood system, resulting in the loss of Fenton catalytic performance. Inspiringly, cuprous ion (Cu1+) demonstrates a high catalytic activity in mild acid or even neutral environment, and thus copper-based Fenton catalyst holds a great promise in developing novel tumor treatment reagents [19].
Despite abnormally high expression of hydrogen peroxide in the tumor microenvironment [20], however, an increasing number of reports have indicated that endogenous H2O2 still cannot meet the requirement of chemical kinetic reactions to produce sufficient ∙OH for high efficient CDT [21, 22]. Therefore, Given CDT efficiency is highly dependent on the concentration of H2O2, several literature have put forward Fenton-type metal peroxide nanoagents for more active CDT via self-supplied H2O2 in tumor acidic microenvironment [23]. Among these, copper peroxide (CP) nanoparticles, reportedly, the first proposed Fenton-type metal peroxide nanomaterial, exhibit a high efficient CDT by virtue of high efficient Fenton catalytic reaction rate of cuprous ions and self-supporting H2O2 in tumor acidic microenvironment [23]. However, CP based CDT strategy finds difficulty in completely inhibiting tumor growth and preventing tumor metastasis. To further improve chemical dynamic therapy, several other optimized therapy strategy basing on CP nanoparticles have been proposed, including the synergistic strategy between mitochondrial injury and CDT triggered by calcium and copper bimetallic peroxides [24], the combination of chemotherapy and CP-mediated CDT [25], the engineering dual catalytic therapy via liposomal delivery of nanosized CP and artemisinin [26], reactive oxygen species (ROS)-based chemo/photo-dynamic therapy [27, 28]. Moreover, Deng, et al., reported enhanced lysosomal retention of CP and subsequent Fenton reactions happened inside the lysosomal compartment would curb cytoplasmic antioxidant system-induced clearance of ∙OH and induce robust lipid peroxidation and tumor growth inhibition [29]. Hence, Given CDT is often limited by low treatment efficiency [30, 31], up-regulating of oxidative stress by copper peroxide while blocking the negative effect of cytoplasmic antioxidant system could represent a hopeful strategy for developing an enhanced CP-based CDT nanomedicine. However, everything has its opposite side. The development of copper-based tumor therapeutic strategy would also bring concerns about biosafety. Copper is an essential trace element for living organisms, underlying many biological processes, excessive copper may contribute to the potential toxicities regarding liver cirrhosis, hemolysis and damage to renal tubules, etc. [32, 33]. Additionally, cuprous ions are generally considered more harmful in living organisms than divalent copper ions. Hence, the potential systemic toxicity should also been addressed when designing copper-based tumor therapeutic strategy [34].
Reasonably designed or biomimetic based nanoplatforms are expected to achieve the remodeling of the tumor microenvironment and promote effective tumor the [35,36,37,38]. In the present study, we discovered a catalytic nanoplatform (a folate acid conjugated liposomal nanosystem loaded with copper peroxide nanoparticles (CP) and chloroquine (CQ), denoted as CC@LPF), rationally designed under the guidance of biological effect research, was proposed to realize maximum tumor cell death induction while remodeling the tumor immune microenvironment (Scheme 1). Herein, Both in vitro and in vivo study indicated a joint administration of CP and chloroquine demonstrated a synergistic tumor cell growth inhibition of CP and CQ, which was dependent on robust ROS induction rather than autophagy modulation. We further uncover the upregulation of endogenous copper by CQ and supplementation of exogenous copper by CP synergistically elicit amplified reactive oxygen species (ROS) generation. Besides, the hydrogen peroxide released from CP in response to the acidic environment provides sufficient substrates for Fenton catalytic reactions. On the other hand, the joint use of CP and CQ elicited an early onset, above all, long-term high-level existence of ICD features, which is associated with ROS generation and endoplasmic reticulum (ER) stress. Tremendous accumulation of autophagosomes did not contribute the synergistic tumor cell toxicity, however, related with ER stress induction. Given there are certain other limitations to copper peroxide-based tumor treatment methods, such as systemic toxicity, tumor targeting, etc., tumor targeting delivery nanoplatform CC@LPF constructed and exhibiting a superior tumor uptake efficacy, tumor tissue targeting capability and satisfactory biosafety. Lastly, CC@LPF was also evidenced as an immunotherapeutic adjunct, when combining with immunocheckpoint inhibitors, demonstrated a more significant tumor inhibition via enhancing immunogenicity and dendritic cell maturation of tumor microenvironment.

Rationally designed nanoplatform for enhanced chemoimmunotherapy via deploying endogenous plus exogenous copper and remodeling tumor microenvironment
Methods
Chemicals and reagents
Chloroquine phosphate (CQ; HY-17589) plus folic acid (HY-16637) were provided by MedChemExpress. Wortmannin (S2758), purchased from Selleck Chemicals. Polyvinylpyrrolidone (PVP)-K30 (9003-39-8) was purchased from Beijing Wokai Biological Technology Co.,LTD. Puromycin dihydrochloride hydrate (A610593), collagenase type IV (A004186) and 3,3,5’,5’-Tetramethyl benzidine (TMB) (A600954) were obtained from Sangon Biotech. Hydrogenated soy phosphatidylcholine (HSPC; 92128-87-5) and cholesterol (57-88-5), available from AVT (Shanghai) Pharmaceutical Technology. DSPE-PEG2000-folic acid (FA) was commercially available from Xi’an Ruixi Biological Technology Co.,Ltd. RPMI-1640 medium (PM150110) and Dulbecco modified Eagle medium (DMEM; PM150210) were purchased from Wuhan Pricella Biotechnology. Cell membrane dye DiIC18(3) (Dil; C101254-1261), DCFH-DA (S0033S), Methylthiazolyldiphenyl-tetrazolium bromide (MTT; ST316) and LysoTracker Red (C1046) were commercialized by Beyotime Biotechnology. Hoechst 33,342 (C0031), calcein acetoxymethyl ester (Calcein-AM)/propidium iodide (PI) kits (CA1630), Annexin V/ANXA5-FITC apoptosis detection kits (CA1020) and ATP Content Assay Kit (BC0305) were obtained from Solarbio Life Science. CuCl2·2H2O, NaOH, glutathione (GSH), Fluorescein isothiocyanate (FITC), 5,5’-Dithio bis-(2-nitrobenzoic acid) (DTNB), Methylene blue (MB) plus hydrogen peroxide (H2O2, GR, 30% by weight) were purchased from Aladdin Reagent Co., LTD. Ti(SO4)2 and indocyanine green (ICG) were obtained from Macklin Company. N-(Rhodamine-6G)lactam-hydrazinecarbothioamide (R6G) (74317-53-6) was commercially available from Heliosense Biotechnologies. The detection kits for aspartate aminotransferase (C010-2-1), alkaline phosphatase (C010-2-1), alanine aminotransferase (C009-2-1) and blood urea nitrogen (C013-2-1) were commercially obtained from Nanjing Jiancheng Bioengineering Institute.
The antibodies for LC3 (AF5402), autophagy related 5 (ATG5; DF6010), GPX4 (DF6701), B-cell lymphoma-2 (Bcl-2; AF6139), copper/zinc superoxide dismutase-1 (SOD1; AF5198) and β-actin (T0022) were obtained from Affinity Biotech. The antibodies for CRT (12238), HMGB1 (3935S) were obtained from Cell Signaling Technology. The antibodies for ATOX1 (22641-1-AP), CCS (22802-1-AP) and PD-L1/CD274 (66248-1-Ig) were obtained from Proteintech Group. The monoclonal antibodies for flow cytometric analysis, including major compatibility complex II (MHC-II) antibodies (11-5321-82; FITC), CD3 antibodies (17-0032-82; APC), CD8a antibodies (45-0081-82; PerCP-Cyanine5.5), CD45 antibodies (30-F11; FITC) were procured from Thermo Fisher Scientific. CD11c antibodies (117343; BV421) were purchased from BioLegend. InVivoMab anti-mouse PD-L1 (B7-H1) antibody (α-PDL1; BP0101) was purchased from BioXCell.
Synthesis and characterization of CP and CC@LPF
Copper peroxide nanospindles were synthesized referring to a previously reported method [23] with minor modifications. Briefly, CuCl2·2H2O (0.01 M) was dissolved in 50 mL deionized water (DIH2O). After the solution was completely dissolved, 2.5 g polyvinylpyrrolidone K-30 was added and dispersed by ultrasonic for 30 min. Sodium hydroxide and H2O2 were added successively, followed by stirring for thirty minutes. Lastly, synthesized CP was obtained by centrifugation.
Preparation of CC@LPF was referring to a previous literature [26]. Briefly, 1 mg CP and 4 mg CQ were dissolved in DIH2O and incubated overnight at room temperature under dark. After centrifuge, precipitation was collected and resuspended with DI water (denoted as A solution). On the other hand, the solvent containing HSPC, cholesterol and DSPE-PEG2000-FA (molar ratio, 6:4:0.5) was evaporated under vacuum to form a thin film. Then, solution A was added to a rotating steam bottle and rotated for 3 min. The bottle was removed and treated with ultrasound for thirty minutes. Finally, CC@LPF, obtained by centrifuge and washing, was maintained in the saline.
Characterizations. A UV/Vis spectrometer (LAMBDA 365, PerkinElmer) were required to determine the properties of nanoparticles and the drug loading capacity. The calculation formula for drug loading capacity: (weight of drug) / (total weight of nano-formulations) × 100%. A transmission electron microscope (TEM; JEOL, JEM-1400) was employed to observe the morphology of the nanoparticles. Dynamic light scattering (DLS; Zetasizer Nano ZS-90, Malvern) was deployed to determine size and zeta potential of nanoparticles. The X-ray diffraction (XRD) pattern was performed by X-ray diffractometer (D8 advance, Bruker). The Thermo ESCALAB 250XI electron spectrometer was used to obtain X-ray photoelectron spectra (XPS). The concentrations of copper ions in the different nanoformulations were determined by virtue of inductively coupled plasma optical emission spectrometry (ICP-OES; PerkinElmer Avio 220 Max). The Fourier transform infrared (FTIR) spectra was detected by an AVATAR 360 FTIR spectrophotometer.
Cells and cell culture
Mouse colon tumor cell line CT26 and transformed Human Liver Epithelial-3 (THLE-3) were cultured in RPMI-1640 medium. Mouse fibroblast L-929 and human embryonic kidney 293T (HEK-293T) cells were cultured with DMEM medium. All culture media contained 10% fetal bovine serum, 100 µg/mL penicillin and 100 µg/mL streptomycin. All cells were maintained in an incubator at 37 °C in a 5% CO2 atmosphere.
Cell viability
The cells were incubated with different treatments for the indicated time. Then, after the removal of the medium, fresh medium containing 0.5 mg/mL MTT was individually added, followed by the incubation for 4 h at 37 ℃. Next, the medium was replaced by dimethyl sulfoxide (DMSO). After confirming sufficiently dissolving formazan, the absorbance at 490 nm was monitored by virtue of a microplate reader (ELx 808, Bio-Tek).
Western blotting
Cells were collected after different treatments by centrifuge and lysed on ice. Then, cell debris was removed via centrifuge at 12 000 g for ten minutes, followed by mixing with 5 × SDS sample buffer (P1040, Solarbio) and boiling for 10 min. The protein samples were runed on sodium dodecyl sulphate-polyacrylamide gel electrophoresis (SDS-PAGE). After transferring to the PVDF membranes (ISEQ00010, Millipore), 5% non-fat milk was used for 1 h and incubated with a primary antibody. After washing by Tris-buffered saline with Tween 20, the membranes were immersed into horseradish peroxidase-conjugated secondary antibody containing buffer, followed by the incubation for 1 h at room temperature. The protein bands were monitored with an Affinity® ECL Kit (KF001, Affinity Biosciences) under a chemiluminescence instrument (Clinx science, 3100Mini, 90,175).
Knockdown of ATG5 by shRNA
To knock down the expression of ATG5, the shRNA against ATG5 (GCAGAACCATACTATTTGCTT) was constructed into a pLKO.1 vector. The Δ8.9 and VSVG plasmids were co-transfected with the pLKO.1 vector into HEK293T cells. The preparation of lentivirus was conducted using 25 kDa linear polyethylenimine (PEI; 239,662, Polysciences). At 48 h post-transfection, the lentivirus particle containing culture medium was passed through a 0.45 μm filter membrane. Medium containing lentiviral particles and polypyrene (5 µg/mL) was added to CT26 cells at approximately 60% fusion. After 48 h of culture, puromycin was used to remove uninfected cells.
LysoTracker red staining
GFP tagged LC3 plasmids were constructed into a pLKO.1 vector. CT26 cells over-expressing GFP tagged LC3 (denoted as GFP-LC3/CT26) were constructed using lentiviral infection with reference to the above method. After the incubation process with CP (15 µg/mL) for 24 h, the cells were treated with 75 nM LysoTracker Red for 15 min. The cells were washed three times with phosphate buffer solution (PBS) and observed under confocal microscopy (Stellaris 5, Leica).
ROS detection
Intracellular hydroxyl radical generation was assessed using the DCFH-DA staining kit (S0033, Beyotime). After different treatments, cells were stained with DCFH-DA (10 µM) for 20 min. Subsequently, the DCF fluorescence in the cells was observed on a fluorescence microscope or analyzed by the flow cytometry.
Immunofluorescence staining
For immunofluorescence detection of CRT expression, CT26 cells were seeded into 6-well plate with glass slides and incubated overnight. After being fixed with 4% paraformaldehyde, the cells were blocked with 5% bovine serum albumin (BSA) for 30 min. The slides with cells were incubated with diluted CRT antibodies overnight at 4 ◦C. The cells were then incubated with fluorescent secondary antibody for 1 h. Before and after this procedure, the cells were washed thoroughly with PBS. Cells were stained with 4,6-diamidino-2-phenylindole (DAPI; 10 µg/mL) for 10 min and washed before being added to anti-fade mounting medium. The cells were observed on a laser confocal scanning microscope (CLSM; LSM880, Zeiss).
HMGB1 extraction
HMGB1 proteins were extracted by methanol-chloroform extraction method [39]. Briefly, after the indicated treatment, cell culture supernatants were collected by centrifuge (8 000 g, 5 min) to remove cell fragments. Methanol was mixed with the centrifuged supernatants, followed by chloroform added. The upper phase was removed by centrifugation and 500 µL methanol was added. Then, the mixture was centrifuged at 12,000 g for 10 min, and the centrifuged protein pellet was maintained at room temperature for drying. Lastly, the proteins were resuspended in sample buffer, after boiled, and subjected to western blot analysis.
Cell uptake
FA conjugated and PEGylated liposomes carrying FITC, CP and CQ (denoted as FITC/CC@LPF) were prepared with reference to the section of ‘Synthesis and characterization of CP and CC@LPF’ to investigate the cellular uptake efficiency. CT-26 cells were treated with FITC/CC@LPF for the indicated time at 15 µg/mL, Then, the fluorescence intensity of cells was measured by a flow cytometer (FACSCanto II, BD). To analyze enhanced cell uptake of CC@LPF, the fluorescence images of cells treated with FITC/CC@LPF, FITC/CC@LPF + free FA (1 mM) were obtained by CLSM. Dil (10 µM) was added for 20 min to label the cell membrane.
In vivo fluorescence distributions
In vivo tumor targeting efficiency of CC@LPF was further investigated by recording the near infrared (NIR) fluorescence of ICG. FA conjugated and PEGylated liposomes carrying ICG, CP and CQ (denoted as ICG/CC@LPF) and PEGylated liposomes carrying ICG, CP and CQ (denoted as ICG/CC@LP) were prepared with reference to the section of ‘Synthesis and characterization of CP and CC@LPF’. For in vivo NIR imaging, CT-26 tumor-bearing mice were injected intravenously with ICG/CC@LP or ICG/CC@LPF at 1 mg/kg (equivalent to ICG). Then, In vivo and Ex vivo NIR fluorescence imaging of tumors at different time points after tail injection was monitored by a near infrared live imaging instrument (NIRvana 640, Princeton Instruments). The excited laser power density of 808 nm was at 1.5 W cm− 2 and long pass filter was used to collect NIR images. The relative fluorescence intensity of tumors was analyzed by Image J software.
Hemolysis analysis
Blood from SD rats was centrifuged at 600 g for 10 min. The collected cell pellets were then washed with physiological saline for three times. Afterwards, Cells were treated with the indicated treatments for 12 h. Finally, the solutions in eppendorf tubes were photographed. All animal experiments were conducted under the rules approved by the Animal Ethics Committee of Binzhou Medical University (2021 − 335).
Animal study
CT26 cells of 5 × 10⁵ were implanted subcutaneously on the right sides of Balb/c mice. When the tumor volume reached approximately 100 mm3, the mice were randomly assigned into 7 groups (n = 5) and treated with Saline, LPF, CP@LPF, CQ@LPF, CC@LPF, α-PDL1, α-PDL1 + CC@LPF. The doses of all groups were equivalent to 5 mg/kg copper. Additionally, CQ was 9.6 mg/kg, the dose of α-PD-L1 was 2 mg/kg. The α-PDL1 was administrated by intraperitoneal injection, and received drug treatment every four days, while other drugs were treated by intravenous injection every two days. The tumor volume and body weight were recorded every 2 days with digital caliper and laboratory balance. The tumor volume was calculated using formula: Width2 ×length/2. “width” and “length” were the shortest and longest size of the tumor. After 12 days of treatment, tumors as well as main organs were collected from sacrificed mice for further evaluation.
Tumor tissue sections were immunohistochemical (IHC) staining by Ki-67, CD3 and CD8a antibodies, respectively. Hematoxylin and eosin (H&E) staining was also performed on the major organs and tumor tissues. To examine CD11c+ MHC-II+ DCs in tumor microenvironment, the tumors were collected after treatment, minced and digested in DMEM-F12 with collagenase IV plus DNase I for 30 min at 37 °C. The cell suspensions were filtered through cell strainer to obtain single cells. After washed by PBS, single cell suspensions were stained with CD11c (BV421) and MHC-II antibodies for 1 h, followed by flow cytometry analysis. To examine T cells in the tumor microenvironment, after the indicated treatments, single cell suspensions were stained with CD45 antibodies, CD3 antibodies, and CD8a antibodies for 1 h, followed by flow Cytometry analysis.
Statistical analysis
The statistical data were expressed as mean ± s.e.m. Two-tailed Student’s t-test was used. *p < 0.05, **p < 0.01 and ***p < 0.001 were statistically significant; ns, non-significance.
Results and discussion
Synthesis and characterization of copper peroxide
The as-prepared copper peroxide (CP) nanospindles were synthesized according to an approach reported previously with minor modifications. The results exhibited that CP nanoparticles presented a uniform spindle-like morphology (Fig. 1A) with a DLS size of 131.30 ± 1.87 nm (Fig. 1B). The polymer dispersity index (PDI) of CP nanospindles was around 0.10, suggesting good dispersibility in aqueous solution. The X-Ray diffraction spectrum verified the crystal morphology of CP nanospindles (Fig. 1C). The X-ray photoelectron spectrum revealed the presence of Cu and O elements in CP nanospindles (Fig. 1D). The spectrum of Cu2p featured with two typical peaks at 928.58 eV and 952.58 eV from Cu2+ 2p1/2 and Cu2+ 2p3/2 accompanying with two satellite peaks at 961.95 eV and 941.5 eV (Fig. 1E). Meanwhile, two peaks in O 1s spectrum at 530.7 and 532.5 eV were deconvoluted to C = O plus O-O, respectively, hinting at the existence of PVP plus peroxo groups (Fig. 1F). A permanganate (MnO4−) based colorimetric method was applied to investigate the presence of peroxide bonds in CP nanospindles. Generally, magenta MnO4− could be reduced to colorless Mn2+ ions by H2O2. Similar to H2O2, the color of MnO4− solution faded away rapidly by the CP nanospindles while CuO showed no such phenomenon, indicating the presence of peroxide bonds in CP nanospindles (Fig. 1G).
Inefficient intracellular H2O2 content is one of the major barriers to achieve satisfactory chemodynamic therapy (CDT) efficacy. To surmount these obstacles, researchers have come up with various optimized CDT agents. Catalysts composed of self-supplied H2O2 and Fenton reaction activity have attracted much attention. A colorimetric method based on the principle that Ti4+ and H2O2 reacted to form yellow peroxide-titanium complex was employed to investigate the H2O2 self-supplying performance of CP nanospindles. In the presence of H2O2, a yellow precipitation composed of peroxide-titanium was produced upon the reaction of H2O2 and titanium ions. As shown in Fig. 1H, H2O2 could be efficiently produced at pH 5.5 while no H2O2 was detected when pH value increased to 7.4, implying the pH responsive H2O2 generation performance of CP nanospindles. In addition, with the concentration of CP nanospindles increasing to 100 µg/mL, the concentration of H2O2 produced increased to ~ 235.56 µM (Fig. 1I and S1a), suggesting that CP nanospindles could serve as an efficient exogenous H2O2 repository. In contrast, CuO nanoparticles could not induce H2O2 production (Fig. 1I and S1b).
5,5’-Dithiobis-(2-nitrobenzoic acid) (DTNB), an Ellaman agent, is used to investigate the GSH depletion performance of CP nanospindles. The characteristic peak at 412 nm of DTNB gradually disappeared, implying the excellent GSH depletion performance of CP nanospindles was efficiently (Fig. 1J). Moreover, Cu2+ ions, reduced to Cu+ ions by GSH, could serve as a more efficient Fenton catalyst compared to iron-based ones. Methylene blue was used as colorimetric probe to quantify the hydroxyl radicals (∙OH) production. With the GSH concentration increased from 0 to 4 mM, more ∙OH was produced. However, when the GSH concentration increased over 8 mM, the produced ∙OH was balanced by GSH, further confirming the GSH depletion was important for ROS-based cancer therapy (Fig. 1K).
Encouraged by the GSH depletion and ∙OH production performance, we then explored the in vitro anticancer performance of CP nanospindles. As shown in Fig. 1L, more than 80% cancer cell death was induced at the concentration of 45 µg/mL of CP nanospindles, while only ~ 60% cell viability decrease induced by CuO nanoparticles, implying better chemodynamic therapy efficacy due to the introduction of self-supplying H2O2. Hereafter, the dose close to the half maximal inhibitory concentration of CP nanospindles, 15 µg/mL, was selected for the subsequent in vitro experiment. In addition, after cultured with CP nanospindles and CuO for 6 h, CT-26 cells were stained with DCFH-DA, a ROS fluorescent probe. CT-26 cells incubated with CP exhibited significantly more bright green fluorescence compared to those with CuO nanoparticles, indicating more hydroxyl radicals induced by CP nanospindles (Fig. 1M). Collectively, the as-synthesized CP nanospindles, exhibiting a uniform spindle-like morphology, represent an efficient CDT agent for tumor inhibition via catalyzed GSH consumption and ROS generation (Fig. 1N).

Synthesis, characterizations and in vitro anti-tumor performance of copper peroxide nanospindles. (A-C) TEM images (A), DLS size distributions (B) and XRD patterns of CP (C). (D-F) XPS spectrum analysis of CP. (G) UV-Vis spectra analysis for the existence of peroxo groups in CP nanoparticles. (H and I) UV-Vis spectra of Ti (SO4)2 and CP under various pH values (H) and various concentrations of CP (I). (J) GSH depletion by CP nanospindles after various incubation time. (K) UV-Vis spectra demonstrating the degradation of Methylene blue (MB) by CP nanospindles with various concentrations of GSH. (L) Cell viability analysis of CT-26 cells exposed to different concentrations (equivalent to copper ions) of CP or CuO for 24 h. The experiments were repeated thrice, n = 3. (M) Fluorescence images of CT-26 exposed to the different concentrations (15, 30 µg/mL) of CP or CuO for 6 h and subsequently stained by DCFH-DA (10 µM; 20 min). Cell nucleus were stained by Hoechst 33,342 (HO; 10 µg/mL) for 20 min. (N) A schematic graph showed CP nanospindles could induce activatable ∙OH production and GSH consumption for enhanced chemical dynamic therapy
Autophagy induced by CP exhibited no tumor cell fate determination
Autophagy is a lysosome dependent and dynamic degradation pathway (Fig. 2A), that removes aberrant organelles, misfolded and long-live proteins, and invading pathogens, critically influencing pathogenesis and treatment of human diseases [40, 41]. Basal-level autophagy is a critical mechanism for maintaining cell stability and promoting cell survival, occurring at low levels in almost all mammalian cells. An increase in autophagy level is often observed when cells exposed to physical, chemical, or biological stress [42]. Herein, the as-synthesized copper peroxide nanoparticles were verified to induce autophagic flux. Autophagy related protein LC3 was constitutively expressed and massively distributed in cytoplasm as LC3-I, however, upon autophagic induction, would be cleaved and conjugated to phosphatidyl ethanolamine to form lipidated LC3 (denoted as LC3-II), participating in the assembly of autophagosome (Fig. 2A). Therefore, analyzing LC3 conversion from cytosol LC3 (LC3-I) to lipidated LC3 (LC3-II) by immunoblotting could be used to investigate autophagic induction. As displayed in Fig. 2B and C, the as-synthesized CP nanoparticles induced LC3 conversion, with concentration- and time- dependent patterns. To lead more proof, CT26 cells over-expressing GFP tagged LC3 (denoted as GFP-LC3/CT26) were constructed. The binding of GFP-LC3 to autophagosomal membranes, usually observed as green dots, is a reliable indicator for autophagosome formation [43, 44]. On the other hand, GFP-LC3 dots co-localization with lysosomes reflect autolysosome formation, critical for the degradation of autophagic cargo [43, 44]. As observed under a confocal microscope, CP could induce GFP dot formation, which exhibited an obvious co-localization with LysoTracker Red-indicated lysosomes (Fig. 2D). These results demonstrated that CP nanoparticles could induce auto-lysosome formation without disrupting autophagosome-lysosome fusion. Chloroquine (CQ), an antimalarial agent, also could block the downstream of autophagy process by virtue of alkalizing lysosome and inhibiting autophagosome-lysosome fusion [45]. Herein, in the presence of CQ, CP could further raise LC3-II accumulation, indicating that CP really induced autophagic induction rather than autophagic blockage (Fig. 2E). To sum up, the as-synthesized CP nanoparticles actually elicited autophagy.
Autophagy induction is a hallmark under various pathological and pathophysiological conditions, possibly promoting death or survival, which are two distinct paradigms that determine cell fate. In most cases, autophagy provoked by nanomaterials promotes cell death, but a large number of nanomaterials can also trigger survival-promoting autophagy [42, 44, 46,47,48]. Based on the decisive role of nanomaterial-induced autophagy in tumor cell fate, effectively avoiding or amplifying autophagy induced by nanomaterials may become an increasing new weapon against cancers, especially those that are difficult to treat and drug-resistant [46, 48, 49]. Hence, uncovering the determination of CP-induced autophagy on tumor cell fate is critical for propelling CP-based tumor catalytic therapy. However, our study demonstrated that autophagy induced by CP presented no effect on cell fate. Wortmannin was reported to block autophagic initiation via inhibiting class III phosphatidylinositol 3-kinase (PI3K) and widely used as autophagic inhibitors [50, 51]. In the present study, both western blot analysis and the parallel statistical analysis (Fig. 2F) indicated autophagy elicited by CP could be significantly attenuated by wortmannin. However, autophagy inhibition by wortmannin would not affect CP elicited cell death (Fig. 2G), which indicated autophagy induced by CP exhibited no cancer cell fate decision. To provide more evidence, shRNA against ATG5 was deployed to abrogate the expression of ATG5 in CT-26 cancer cell line. ATG5 is a critical component of autophagy, participating the regulation of autophagosome formation and expansion [52]. Herein, immunoblotting and statistical results demonstrated that the decreased expression of ATG5 could significantly suppress autophagic induction by CP (Fig. 2H). Nevertheless, the expression abrogation of ATG5 also showed no any significant influence on CP elicited cancer cell death (Fig. 2I). Collectively, although the as-synthesized copper peroxide nanoparticles induced autophagy, the autophagy induced by CP had non influence on cell fate determination.
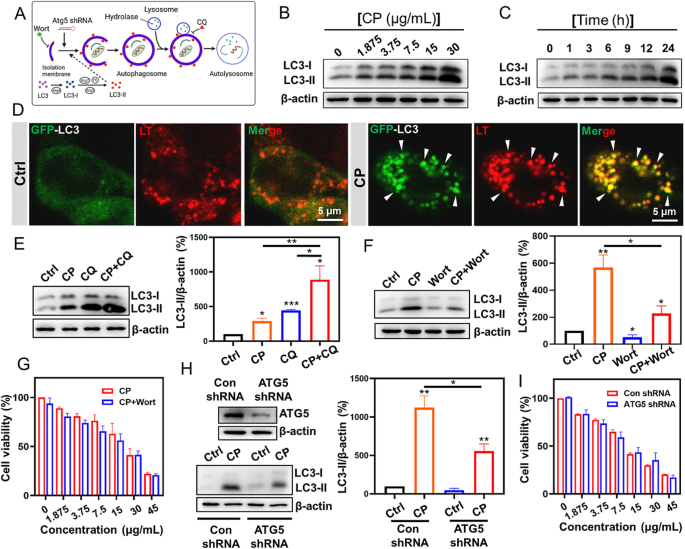
Autophagy induced by CP exhibited no tumor cell fate determination. (A) A schematic illustration of autophagy process, during which, several autophagy inhibiting approaches were also listed. Wort: Wortmannin; CQ: chloroquine. (B-C) Western blot analysis of CT-26 after the incubation with different doses of CP for 24 h (B), or treated with CP (15 µg/mL) for the indicated times (C). (D) Confocal fluorescence images of LysoTracker™ Red (LT) stained GFP-LC3/CT-26 cells after the treatment with CP (15 µg/mL) for 24 h. Lysosomes were indicated by LT (75 nM) staining for 15 min. (E) Western blot analysis of LC3 proteins in CT-26 cells exposed to the treatments for 24 h and the results were analyzed by virtue of Image J software. CP, 15 µg/mL; CQ, 50 µM. The experiments were repeated thrice. (F) immunoblotting analysis of LC3 in CT-26 cells after the indicated treatments for 24 h. CP, 15 µg/mL; Wortmannin (Wort), 300 nM. The experiments were repeated four times. (G) Cell viability for CT-26 after exposed to the indicated treatments. Wortmannin: Wort; 300 nM. Triple individual experiments were performed; n = 3. (H) The expression of ATG5 was diminished by ATG5 shRNA in CT-26 cells (the upper panel). Immunoblotting analysis of the conversion of LC3 proteins in CT-26 cells after the different treatments for 24 h. CP, 15 µg/mL. The experiments were repeated thrice. (I) Cell viability analysis of CT-26 cells after exposed to the indicated concentrations of CP in the presence or absence of ATG5 expression attenuation. Triple individual experiments were performed. n = 3
Synergistic tumor inhibition of CP and CQ dependent on ROS generation irrespective of autophagosome accumulation
Although autophagy induced by CP had no effect on tumor cell fate determination, and curbing autophagosome formation would not enhance CP induced cell death, a combined administration of CP and CQ demonstrated a synergistic tumor cell inhibition, meanwhile, which also exhibited the highest induction of autophagosome accumulation. As shown in Figure S2a and S2b, CQ at the dose range of 12.5 µM ~ 100 µM demonstrated obvious synergistic inhibition of tumor cell viability and elicitation of cell death with CP, especially at the dose of 50 µM. An in vivo study further set forth the joint anti-tumor efficacy of CP and CQ in CT-26 cell-grafted mice models. Herein, the dosage of CP, that is 5.0 mg/kg (equivalent to copper ions), was used with reference to the previous literature [23]. Different treatment agents were individually administrated by intro-tumor injection every two days, during which the tumor volume was recorded. After the mice were sacrificed, the body plus tumor weights were measured. As shown in Fig. 3A and C and S3, the joint use of CP and CQ demonstrated more significant tumor inhibition relative to either CP or CQ group, underlying the synergistic anti-tumor effect of CQ and CP. However, consistent with cell-based experiments, the in vivo study also indicated that wortmannin, whose usage was referring to the previous literature [53] could not influence anti-tumor efficiency of CP. On the other hand, the joint use of CP and CQ induced more obvious LC3-II accumulation (Fig. 3D and E). Hence, it was further investigated whether the synergistic tumor cell toxicity by CP and CQ depended on the robust autophagosome accumulation, due to autophagic induction by CP and blockage of the downstream of autophagy process by CQ. As shown in Fig. 3D-F, abrogation of the expression of ATG5 could not change the effect of the joint use of CP and CQ on cell viability. To sum up, even though the joint use of CP and CQ induced more obvious LC3-II accumulation, the synergistic tumor cell inhibition of CP and CQ independent on autophagosome accumulation.
Several literature have actually demonstrated that tumor suppression caused by chloroquine per se or chemotherapy sensitization caused by chloroquine is independent of autophagy [54,55,56], However, whose potential mechanisms, especially those found in this article, still need to be elucidated. Given copper peroxide nanoparticles showed a remarkable ROS generation and CT26 tumor cell toxicity through self-supplying H2O2 and Fenton reaction, therefore, whether did the joint use of CP and CQ induced more ROS generation underlying this synergistic tumor inhibition? Herein, a ROS fluorescent probe, DCFH-DA, was employed to analyze cellular ROS level. As we speculated, flow cytometry results (Fig. 3G and H) and the fluorescence images (Figure S4) strongly confirmed the combined utilize of CP and CQ induced a more robust ROS generation relative to either CP or CQ per se. Besides, abrogation of ROS generation by an antioxidant agent (NAC) eliminated CP or CP + CQ induced CT26 tumor cell death (Fig. 3I and J), indicating that CP or CP + CQ induced ROS generation contributed to tumor cell death. Taken together, synergistic tumor inhibition by the combined use of CP and CQ was resulting from a robust ROS generation. Further study demonstrated that ROS critically regulated autophagosome accumulation in the joint treatment, however, autophagosome accumulation did not contribute ROS generation. As shown in Figure S5a, the robust LC3-II protein accumulation by the joint treatment with CP and CQ could be significantly abrogated by NAC. We also conducted genetic knockdown assay. The results showed that ATG5 expression attenuation exhibited negligible influence on the ROS level of the joint treatment with CP and CQ (Figure S5b). Collectively, although ROS as an upstream signal reinforced autophagosome accumulation, the synergistic tumor inhibition by the combined use of CP and CQ was resulting from a robust ROS generation, rather than autophagosome accumulation.
The potential mechanism regarding robust ROS generation induced by the joint use of CP and CQ was further investigated. Herein, we first elucidated that endogenous copper was motorized by CQ for ROS generation. As illustrated above, CQ alone could induce significant ROS generation (Fig. 3G, H and J). Intriguingly, it was demonstrated that CQ could interfere cellular copper homeostasis and significantly raise cellular copper concentration when cells cultured in complete culture medium containing serum (Fig. 3K). The increase of copper uptake or/and decrease of copper efflux would increase cellular copper content. The formula table of RPMI-1640 medium used in our experiment was checked to be copper free. And it’s also demonstrated that the source of copper in cell culture medium is serum [57]. Hence, the cellular copper contents in CT26 cells treated with or without CQ in serum-free RPMI-1640 medium were further investigated. As shown in Fig. 3K, CQ could still significantly raise the cellular copper level in serum-free RPMI-1640 medium. Besides, serum withdrawal absolutely decreased the cellular copper contents, while presenting no significant influence on the cellular copper contents in CT26 in the presence of CQ (Fig. 3K). These results suggested that the inhibitory effect of CQ on copper efflux may be the main reason for the increase of cellular copper content. On the other hand, N-(Rhodamine-6G)lactam-hydrazinecarbothioamide (R6G) was used for the determination of intracellular copper ions [58]. As shown in Fig. 3L and M, both flow cytometry analysis and subsequent statistical results demonstrated that, regardless of the presence or absence of serum, CQ could significantly up-regulate the levels of cellular copper ions.
Considering that CQ could interfere with copper efflux, thereby increasing cellular copper content and copper ion levels, the possible molecular mechanisms were further investigated. The Cu-ATPases ATPase 7 A and ATP7B act as the major copper exporters, which assisted by chaperone antioxidant protein 1 (ATOX1) responsible for transferring Cu to ATP7A and ATP7B in the trans-Golgi network (TGN) [33]. Herein, ATOX1 expression was investigated by western blotting and demonstrating an obvious down-regulation, suggesting a possible mechanism of copper efflux inhibited by CQ (Fig. 3N and O). The cytoplasmic copper chaperone for superoxide dismutase (CCS) reportedly delivers Cu to superoxide dismutase 1 (SOD1) to detoxify ROS and maintain Cu homeostasis [59]. The expressions of CCS and SOD1 were further explored and demonstrated a significant down-regulation induced by CQ treatment. Therefore, the inhibition of copper efflux and down-regulations of copper chaperone proteins and SOD1 may trigger endogenous copper ion bioavailability, accounting for ROS generation induced by CQ. Indeed, in addition to ATOX1, CCS and SOD1, some other proteins, including metallothionein, synthesis of cytochrome oxidase 1/2, copper chaperone for cytochrome c oxidase 11/17, etc., also participate in maintaining appropriate cellular copper homeostasis at the cellular level [59]. Besides, it was demonstrated that CQ could bind cations (metals, proton) via their nitrogen and oxygen atoms [60]. Therefore, whether CQ increases cellular free copper ion level by affecting the expression of other copper binding proteins or competitively binding to copper ions remains a question that needs further exploration.
Furthermore, the joint use of CP and CQ also induced the down-regulations of ATOX1, CCS and SOD1 (Fig. 3P). Both fluorescence images and subsequent statistical results demonstrated that CQ alone or its combination with CP actually induced more significant copper ion accumulation (Fig. 3Q), which would supply sufficient Fenton catalytic ions for high efficiency CDT. Additionally, GSH could be consumed by CP at acidic environment. GPX4 is an antioxidant enzyme, whose inhibition could enhance ROS generation [61]. And GSH consumption reportedly would result in GPX4 inhibition [62]. Bcl-2, a main antiapoptotic protein, targeting which represents a promising tumor therapy strategy [63]. As shown in Fig. 3R, the joint use of CP and CQ obviously elicited synergistic down-regulations of GPX4 and Bcl-2. Therefore, mechanistically, upregulation of endogenous copper ions by CQ and supplementation of exogenous copper ions by CP synergistically elicit a robust reactive oxygen species (ROS) generation. The hydrogen peroxide released from CP in response to the acidic environment provides sufficient substrates for Fenton catalytic reactions.
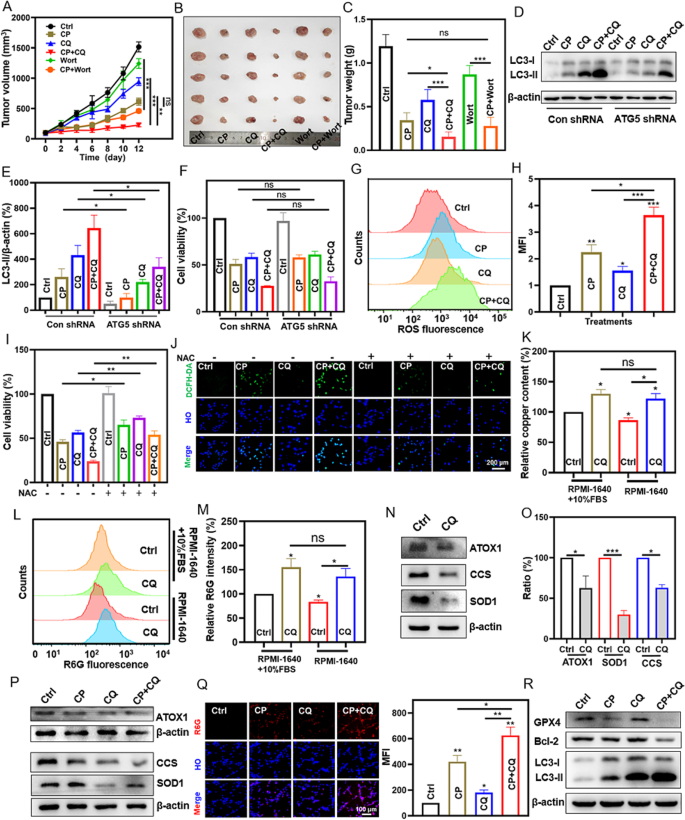
Synergistic tumor inhibition of CP and CQ dependent on ROS generation and irrespective of autophagosome accumulation. (A) Tumor volume curves were monitored during different treatments by intratumoral injection. CP, 5 mg/kg; CQ, 8.56 mg/kg; wortmannin (Wort), 0.35 mg/kg. n = 5. (B and C) Photograph images and average tumor weights of the dissected tumors after the indicated treatments. n = 5. (D and E) Western blot analysis (D) of CT-26 cells exposed to the indicated treatments in the presence or absence of ATG5 expression attenuation. Image J software was used (E). CP, 15 µg/mL; CQ, 50 µM. Triple individual experiments were performed. (F) Cell viability analysis of CT-26 cells after the indicated treatments for 24 h in the presence or absence of ATG5 expression attenuation. CP, 15 µg/mL; CQ, 50 µM. Triple individual experiments were performed. n = 3. (G and H) ROS analysis by flow cytometry after CT-26 after exposed to different treatments for 24 h and then stained with DCFH-DA (10 µM; 20 min). Triple individual experiments were performed. (I and J) Cell viability analysis (24 h treatment) and ROS analysis (6 h treatment) of CT-26 cells after the indicated treatments. CP, 15 µg/mL; CQ, 50 µM; NAC, 5 mM. (K) Total copper contents in CT-26 cells after the indicated treatments for 12 h was quantified by ICP-OES. CQ, 50 µM. (L and M) Flow cytometry analysis of R6G (10 µΜ; 20 min) staining in CT-26 cells after exposure to the different treatments for 6 h. CQ, 50 µΜ. Triple individual experiments were performed. (N and O) Western blot analysis of LC3 proteins in CT-26 cells exposed to the treatments for 12 h and the results were analyzed by virtue of Image J software. CQ, 50 µM. The experiments were repeated thrice. (P) Western blot analysis of ATOX1, CCS and SOD1 proteins in CT-26 cells after the indicated treatments for 12 h. CP, 15 µg/mL; CQ, 50 µM. (Q) Fluorescence images stained by R6G (10 µΜ; 20 min) for CT-26 after the indicated treatments for 6 h. CP, 15 µg/mL; CQ, 50 µΜ. λex = 495 nm. (R) Western blot analysis of CT-26 cells after the indicated treatments for 24 h. CP, 15 µg/mL; CQ, 50 µM
Immunogenic cell death induction via reactive oxygen species generation
The above results demonstrated a synergistic tumor inhibition of CP and CQ dependent on ROS generation. In this study, so we wandered whether the joint use of CP and CQ could induce immunogenic cell death features in tumor cells. ICD is featured by elicitation of distinct DAMPs, including exposure of CRT on cell membrane, HMGB1 secretion, and ATP release. Herein, CP was demonstrated to trigger ICD, nevertheless, upon combing with CQ, induced a robust and long-lasting ICD feature. CRT sub-cellular location was visualized by immunofluorescent staining. As showed in Fig. 4A, CRT was mainly expressed in the cytoplasm of CT26 tumor cells in the control and CQ-treated groups, however, an obvious CRT translocation to the cell membrane was observed in CT-26 cells treated with the combined administration of CP and CQ for 12 h, more pronounced than the CP treatment group (Fig. 4A). After 24 h treatment, both the joint group and CP group exhibited remarkable CRT cell membrane localization (Fig. 4A). Meanwhile, we detected the extracellular release of HMGB1 in the cell cultured media by western blotting. The treatment with CP plus CQ for 12 h elicited more significant HMGB1 extracellular release along with the decreased intracellular expression level, while CP or CQ did not (Fig. 4B and S6a). After 24 h treatment, CP alone treatment actually enhanced HMGB1 release, but both the representative western blot result and the statistical data consistently suggested that the joint use of CP and CQ did better (Figs. 4B and S6b). The additional experiment was performed to investigate the ATP release after the different treatments. As shown in Figure S7, CP could significantly induce ATP release into the cell culture medium. Additionally, CQ alone would not significantly induce ATP release, and influence CP-induced ATP release. Collectively, these results demonstrated that the joint use of CP and CQ could induce ICD related features.
The ‘integrated stress response’ (ISR) is derived from the phosphorylation of eukaryotic translation initiation factor 2 subunit alpha (eIF2α) [6]. Compared to cytotoxic drugs that do not induce ICD effects, most methods of inducing ICD effects can effectively stimulate eIF2α phosphorylation, which is considered an important marker of ICD [7]. The unfolded protein response (UPR) triggered by endoplasmic reticulum (ER) stress is part of the ISR. During the activation of the UPR, IRE1α (a sensor on the ER membrane) cleaves XBP1 mRNA through its endoribonuclease activity, producing the spliced form of XBP1 [64]. The reactive oxygen species (ROS) was prominently elevated after the combined use of CP and CQ treatment. The ROS -mediated ER stress in pre-apoptotic stage cells is clearly linked to immunogenic cell death (ICD). As shown in Fig. 4C and Figure S8, relative to CP or CQ -treated group, the joint use of CP and CQ triggered a more significant phosphorylation of eIF2α and notable expression of XBP1. Moreover, the phosphorylation of eIF2α could be abolished by the ROS inhibitor NAC. Further experiments were performed and demonstrated that the joint use of CP and CQ triggered immunogenic cell death via ROS generation. Abrogation of ROS generation by an antioxidant agent (NAC) eliminated CP + CQ induced CT26 tumor immunogenic cell death, as evidenced by the silence of CRT translocation to the cell membrane and HMGB1 extracellular release (Fig. 4D and G). On the other hand, tremendous accumulation of autophagosomes induced by the joint use of CP and CQ did not contribute to the synergistic tumor cytotoxicity (Fig. 3D and F), however, related with ER stress induction, HMGB1 release and the exposure of CRT on cell membrane (Figure S9a-b and S10a-S10c). To summarize, these biomarkers were known as DAMPs and their concomitant presence implied immunogenic cell death. Besides, the joint use of CP and CQ elicited an early onset, above all, long-term high-level existence of ICD markers, which is strongly associated with ROS generation and autophagosome accumulation.

ICD induced by the joint use of CP and CQ was related to ROS-mediated ER stress. (A) CRT immunofluorescence imaging of CT-26 cells after exposed to the indicated treatments for 12–24 h. (B) Western blot analysis of HMGB1 in the supernatant (SN) and cytosol (CS) after CT-26 cells exposed to the indicated treatments for 12–24 h. (C, E-G) CT-26 cells exposed to the indicated treatments for 12 h were subjected to western blot analysis for phosphorylated eIF2α (p-eIF2α), HMGB1 in supernatant (SN) and cytosol (CS). The lower panel of (C) showed the statistical data. The statistical data (F and G) was from (E). The experiments were repeated thrice. CP, 15 µg/mL; CQ, 50 µM; NAC, 5 mM. (D) CRT immunofluorescence imaging of CT-26 cells after the indicated treatments for 12 h. CP, 15 µg/mL; CQ, 50 µM; NAC, 5 mM
CC@LPF exhibiting enhanced tumor cell uptake, selective tumor cytotoxicity, and biosafety
As illustrated above, the joint use of CP and CQ, not only realized the maximized direct killing effect on tumor cells but also increased the immunogenicity of the local tumor micro-environment, was considered as an effective strategy for tumor treatment. Nevertheless, there are still certain limitations to copper peroxide or chloroquine based tumor treatment methods, such as the potential systemic toxicity, low efficiency of tumor targeting, etc. [3, 65]. Herein, to increase the efficiency of CP in tumor suppression combined with CQ, Folic acid (FA) conjugated and PEGylated liposomes (LFA) were employed for the delivery of CP and CQ (Figure S11). The as-synthesized FA conjugated PEGylated liposomes carrying CP and CQ (denoted as CC@LPF; Fig. 5A and S11) received systematic characterization. The morphology of the as-prepared CC@LPF hardly changed compared to CP nanospindles (Fig. 5A). The zeta potential of CQ@CP was ~-10 mV, while that of CP nanospindles was ~ 5.02 mV, implying the feasibility of loading CQ on CP nanospindles via electrostatic adsorption (Fig. 5B). Then the negatively charged CQ loaded CP nanospindles (CQ@CP) were decorated by folate conjugated DSPE-PEG (denoted as CC@LPF) via hydrophilic-hydrophobic interactions. The CC@LPF nanoparticles presented a zeta potential of ~-21.33 mV, which was beneficial for circulation stability of the in vivo treatment. In addition, the size of CC@LPF increased to ~ 276.1 nm after the modification of folate conjugated DSPE-PEG2000-FA (Fig. 5C). We also investigated the colloidal stability of CC@LPF nanoparticles. In each of the solutions, including PBS, 0.9% saline, RPMI-1640 culture medium and 10% fetal bovine serum, the PDI of CC@LPF was always below 0.20 (Figure S12a-S12d), suggesting a good dispersibility. Besides, CC@LPF, even maintained in different solutions at room temperature for 14 days, also exhibited no significant changes on the size and PDI (Figure S12a-S12d), indicating an excellent colloidal stability. In the FTIR spectra, the bands located at 1 680 cm− 1 and 1 050 cm− 1 were assigned to the stretching vibration of C = O bonds and the asymmetrical stretching vibrations of -C-O-C- of DSPE-PEG2000-FA, respectively, suggesting the successful PEGylation of CQ@CP (Fig. 5D). In addition, the band of the CC@LPF located at 1 611 cm− 1 was attributed to the bending vibration of N-H bonds of CQ, suggesting the successful loading of CQ on CP nanospindles. Meanwhile, the UV-Vis spectra of CQ@CP and CC@LPF demonstrated one characteristic absorption peak at 343 nm of CQ while CP@LPF presented no absorption peaks, further illustrating the successful carrying of CQ (Fig. 5E). The optimized encapsulation and loading efficiency of CQ were calculated to be 44.48% and 17.37%, respectively. In addition, the encapsulation and loading efficiency of CP were 92.67% and 9.04%, respectively.
Then the copper ion release performance of CC@LPF at various pH values was investigated using ICP-OES. Approximately, copper ions burst out from CC@LPF after incubation at pH 5.5 for 1 h (Fig. 5F). After 24 h, about 67.81% copper ions liberated from CC@LPF, which potentially facilitated the GSH consumption and ROS production for CDT therapeutic efficacy. In contrast, copper ions were scarcely released in the neutral medium, implying an excellent pH-responsive release performance of CC@LPF. The generation of ∙OH by CC@LPF was examined using MB and 3,3’,5,5’-tetramethylbenzidine (TMB) as colorimetric probes. Inspiringly, CC@LPF induced a similar degradative effect of MB compared to CP nanospindles at the same pH values and concentrations, indicating the modification of CQ and FA did not weaken the ROS production of CP nanospindles (Fig. 5G). Moreover, CC@LPF and CP induced similar TMB chromogenic reaction at the same condition, further confirming the ROS generation of CC@LPF (Figure S13). Folic acid (FA) receptors are highly expressed on the cellular membranal surface of various cancer cells. Accordingly, FA was widely used as an active, safe, and efficient targeting molecule to cancer cells. Herein, the targeting efficiency of CC@LPF was investigated by detecting the variation of intracellular copper concentration. As shown in (Figure S14a), in comparison with CP nanospindles, the intracellular copper concentration increased to ~ 1.76 fold after incubation with CP@LPF for 6 h, indicating the remarkably enhanced uptake of CC@LPF.
To further uncover the mechanism of FA enhanced cell uptake, free FA was used to block the FA receptor on the surface of cancer cell, and FA conjugated and PEGylated liposomes carrying FITC, CP and CQ (denoted as FITC/CC@LPF) were constructed (Figure S14b). After the incubation with FITC/CC@LPF for the different time, CT-26 cells exhibited time-dependent increase of FITC fluorescence intensity (Figure S14c). After incubation with FITC/CC@LPF for 2 h and 6 h, the confocal laser scanning microscope images presented bright green fluorescent signal (Fig. 5H). In contrast, almost no green fluorescence presented when incubated with free FA and CC@LPF (Fig. 5I), suggesting that FA played an important role on cell uptake of CC@LPF nanoparticles. Taken together, the successful loading of CQ and conjugation of FA of CC@LPF served as a H2O2 self-supplied, pH-responsive and active targeting nanoplatform for CDT tumor therapy.

Preparation of CC@LPF for enhanced tumor cell uptake. (A) TEM images of CC@LPF. (B) Zeta potentials of various nano-formulations. (C) DLS size distributions of various formulations. (D) FTIR spectra of CP, CQ, LPF, CP@LPF, CQ@LPF, CC@LPF. (E) The UV–vis absorption spectra of CP, CQ, CQ@CP, LPF, CP@LPF, CQ@LPF, CC@LPF. (F) pH responsive release behavior of CC@LPF in the different pH conditioned PBS. (G) UV-Vis spectra demonstrating the degradation of MB by CP nanospindles and CC@LPF with an equivalent concentration (50 µg/mL) under various pH values. (H and I) Fluorescence imaging for the uptake of FITC/CC@LPF CT-26 cells after 2 h and 6 h incubation in the presence of folic acid (1 mM) or not. The experiment was repeated thrice
Due to the specific combination of folate with folate receptor overexpressed on the membranal surface of tumor cells, CC@LPF could be more effectively endocytosed, and exhibited more significant ROS generation plus tumor cell toxicity. As shown in Fig. 6A, CC@LPF caused more obvious ROS generation, relative to the joint use of CP and CQ, CP@LPF or CQ@LPF. MTT assay was further conducted and indicated that CC@LPF treatment triggered more decrease of cell viability relative to either CP@LPF or CQ@LPF treatment (Fig. 6B). Additionally, CC@LPF treatment elicited ~ 82.65% cell viability loss, more than that of the joint use of CP and CQ (Fig. 6B). Calcein AM, a hydrophobic and cell permeable living cell dye, upon entering the cells, would be hydrolyzed to calcein by intracellular esterases and emit green fluorescence after the combination of calcein and intracellular calcium ions. Herein, fluorescence images clearly showed that CC@LPF gave rise to the most decrease of Calcein AM staining, and consistent with which, the maximum cell death (PI positve) was also appearing (Fig. 6C). These results were also confirmed by a additional statistical data of the ratio of live cells/total cells (Fig. 6D). Furthermore, apoptosis analysis was also carried out. As showed in Fig. 6E, folate conjugated lipid system could further reinforce tumor cell apoptosis induction, and CC@LPF exhibited the most apoptosis elicitation.
The liposome delivery strategy could not increase the renal clearance rate of CP, but could improve the blood compatibility of CP. We evaluated the renal clearance time rate of CP and CC@LPF. As shown in Figure S15, the renal clearance rate of CP and CC@LPF nanoparticles was less then 7% at 96 h post injection, suggesting their low renal clearance efficiency. The low renal clearance rate was probably due to the size limitations of glomerular filtration, which allowed the excretion of nanomaterials with the size below 6 ~ 8 nm [66]. The low renal clearance efficiency of CC@LPF was possibly favorable for the in vivo therapeutic efficacy, nevertheless, which would also bring concerns about systemic toxicity. Hence, some necessary safety evaluations are performed. Hemolysis analysis was first conducted and evidenced that the as-synthesized CC@LPF nanocomposite possess blood compatibility. As shown in Fig. 6F, both CP and CP + CQ treatment groups presented significant hemolysis, while CC@LPF treatment group did not. Tumor targeting liposomal delivery of CP and CQ presented selective tumor cell growth inhibition and circumvented CP induced hemolysis. Herein, three easily available non-cancerous cell lines, including human embryonic kidney 293T (HEK-293T), Transformed Human Liver Epithelial-3 (THLE-3) and L929 (L-929) mouse fibroblast, were deployed for the comparative investigation. As exhibited in Fig. 6G, CC@LPF provoked a maximum growth inhibition in CT26 cancerous cells relative to another three non-cancerous cell lines. Hence, Tumor targeting liposomal delivery of CP and CQ improved tumor cell selectivity and blood compatibility of combination therapy.

CC@LPF exhibited enhanced and selective tumor cytotoxicity without causing hemolysis. (A) Fluorescence images of CT-26 cells dyed with DCFH-DA probe after different treatments for 6 h. Vehicle control: Ctrl. (B) Cell viability analysis of CT-26 cells exposed to the different treatments for 24 h. The experiment was repeated thrice. n = 3. (C and D) Calcein AM and propidium iodide (PI) staining of CT26 cells exposed to the different treatments for 24 h. The corresponding statistical analysis were performed by Image J software. The ratios of Live/total cells were indicated by Calcein AM (2 µM) and PI (5 µM) staining for 25 min. n = 3. (E) Apoptosis analysis of CT-26 cells exposed to the different treatments for 24 h. (F) Hemolysis experiments of different concentrations (equivalent to copper ions) of CP, CQ, CP + CQ, CC@LPF. The unit of the numbers in the figure is μg/mL. (G) Cell viability analysis of CT-26, 293T, THLE-3 and L929 cells after the treatment with CC@LPF at different concentrations for 24 h. The experiment was repeated thrice (n = 3). The concentrations used of all groups were equivalent to that of copper ions
In vivo tumor targeting and anti-tumor efficacy of CC@LPF with a PD-L1 inhibitor or not
In vivo tumor targeting delivery of CC@LPF was further studied by recording the NIR fluorescence of ICG, which was currently approved by the US Food and Drug Administration (FDA) as a NIR imaging reagent for clinical use. Meanwhile, to evidence FA played an important role in active targeted delivery capability, FA conjugated and PEGylated liposomes carrying ICG, CP and CQ (denoted as ICG/CC@LPF) and PEGylated liposomes carrying ICG, CP and CQ (denoted as ICG/CC@LP) were prepared. Fluorescence emission spectra and the corresponding fluorescence images of ICG/CC@LPF and ICG/CC@LP with an equivalent ICG concentration demonstrated that ICG was successfully encapsulated in liposomal system (Figure S16a-b). The fluorescence emission spectra showed the emission wavelength around 820 nm. DLS results demonstrated the mean size of ICG/CC@LPF was around 266.93 nm, larger than ICG/CC@LP, indicating the FA coating (Figure S16c). The real-time NIR imaging of mice bearing CT-26 cell transplantation tumors after tail vein injection of ICG/CC@LPF or ICG/CC@LP was further monitored. As shown Fig. 7A and B, we could see that the ICG/CC@LPF was transported into tumor tissue after 0.5 h and reached the maximum intensity at 12-hour time-point, then the signal beginning to fade. Besides, ICG/CC@LPF exhibited more accumulation at tumor sites relative to ICG/CC@LP (Fig. 7B). By virtue of the ex vivo fluorescent imaging of tumors and organs collected at 12 h post injection, it could be obviously captured that ICG/CC@LPF presented the strongest NIR fluorescent signals, more than those of ICG/CC@LP group (Fig. 7C), demonstrating folic acid enhanced tumor targeting delivery.

In vivo tumor targeting and anti-tumor efficacy of CC@LPF with or without α-PDL1. (A and B) In vivo NIR imaging of tumors at different time points after tail injection of ICG/CC@LP and ICG/CC@LPF (1 mg/kg ICG). The tumors were circled and relative fluorescence intensity of tumors was analyzed by Image J software. (C) Ex vivo imaging at 12 h post-injection. (D) A schematic illustration for the therapeutic model. Intraperitoneal injection (i.p.) for α-PDL1; intravenous injection (i.v.) for CC@LPF and others. (E and F) CT-26 xenograft tumor growth curves after tail injection with different treatments. Saline: physiological saline. α-PDL1, 2 mg/kg. The concentrations of all other treatment group were equivalent to that of copper ions 5 mg/kg, and the dose of CQ was calculated as 9.60 mg/kg. (G) Photograph images of dissected tumors from the different groups. (H) Tumor inhibition rate of different groups. n = 5. (I) Body weight variations of mice
Anti-tumor efficiency of CC@LPF and further joint treatment of CC@LPF and PD-L1 blockade antibody were investigated. Herein, we also observed the combined anti-tumor effect of CC@LPF via intravenous injection. A schematic illustration for the therapeutic model was exhibited in Fig. 7D. As shown in Fig. 7E and H, CC@LPF exhibited the strongest tumor inhibition effect relative to either of CP@LPF or CQ@LPF, as evidenced by the most significant decrease of tumor volume and tumor weight, underlying the effectiveness of the combined treatment. ICD refers to an immune stimulated cell death mode in cancer treatment, which is a promising method for sensitizing PD-1/L1 immune checkpoint blockade (ICB) therapy. Considering the CC@LPF could induce selective tumor cell toxicity and ICD, we investigated the in vivo anti-tumor efficacy and safety of the joint treatment between CC@LPF and PD-L1 blockade antibody. For this purpose, we first evaluated the expression of PD-L1 in CT-26 by western blotting. As displayed in Figure S17, CC@LPF would not decrease the basal expression of PD-L1, underlying the possibility of the joint use of CC@LPF and ICB for tumor therapy. Next, CT26-bearing BALB/c mice accepted the different drug formulations, and the tumor inhibition efficiency of different treatments were monitored. Herein, the dosage of PD-L1 blockade antibodies was referring to the previous literature [67]. As shown in Fig. 7F and H, consistent with the previous studies [67], PD-L1 ICB monotherapy was poorly responsed in CT26 tumor model, however, PD-L1 ICB antibody could significantly enhance the antitumor effect of CC@LPF.
The different therapeutic groups exhibited negligible systemic toxicity. As illustrated above, CC@LPF exhibited both selective tumor cell toxicity and blood compatibility. Besides, the animal body weights in the different groups were also monitored during the therapy and the results indicated that different therapeutic models would not elicit mouse body weight loss (Fig. 7I). Additionally, considering the existing liver distribution behavior (Fig. 7C) and low renal clearance rate of CC@LPF (Figure S15), some blood biochemical indexes related to liver or kidney injury, were further monitored to evidence the safety of CC@LPF based therapeutic strategy. As shown in Figure S18a-S18d, the different treatments in mice, including CC@LPF, would not obviously affect the level of alkaline phosphatase, alanine aminotransferase, aspartate aminotransferase or blood urea nitrogen, suggesting the safety of CC@LPF based therapeutic strategy.
Collectively, the as-synthesized CC@LPF, potentiated as tumor therapy agents, exhibited a negligible systemic toxicity and the capabilities of tumor cell killing and synergistic tumor therapy with ICB.
The mechanism of the joint anti-tumor effect of CC@LPF and ICB
Then, the mechanism of the joint treatment of CC@LPF and PD-L1 blockade antibody was investigated at the organizational and cellular levels. The direct impact of ICD in tumor microenvironment acts on the dendritic cells (DCs). The released HMGB1 and CRT from tumor cells bind TLR4 and CD91 on the DCs, respectively, resulting in the DCs mature and IL-1β secretion. Moreover, the tumor antigen was internalized and presented by DCs, which would lead to the activation of tumor infiltrating T cells. Here, we firstly detected the CD11c+ MHC-II+ DCs infiltration in tumor microenvironment (TME) by flow cytometry according to the gating strategy in Figure S19. As shown in Fig. 8A and C, the proportion of CD11c+ MHC-II+ DCs cells were obviously raised in CC@LPF treatment group. Intriguingly, CQ@LPF, but not CP@LPF, significantly increased the proportion of CD11c+ MHC-II+ DCs, and there was no significant difference between CC@LPF and CQ@LPF, suggesting CC@LPF regulated the proportion of CD11c+ MHC-II+ DCs mainly via CQ. These results were also consistent with the previous reports, which indicated that CQ could abrogate lysosome-dependent degradation of MHC-II [68, 69] and promote DCs mature plus antigen presentation [70, 71]. Moreover, α-PDL1 monotherapy presented no influence on the proportion of DCs in this research model. Besides, although the combination of α-PDL1 + CC@LPF further increased the proportion of DCs in TME, there was no significant difference between α-PDL1 + CC@LPF and CC@LPF treatment groups (Fig. 8A and C), which indicated that the CC@LPF mono-treatment could well boost the DCs infiltration in the TME. We further detected the T cell infiltration in the TME by IHC staining and flow cytometric analysis. Herein, the flow cytometric analysis for CD3+ T cells and CD3+ CD8+ T cells were according to the gating strategies in Figure S20 and S21. Consistently, compared to those of CC@LPF treatment group, tumors grown on the mice exposed to CC@LPF plus α-PDL1 antibodies showed significantly improved proportions of T cells (CD3+) and cytotoxic T cells (CD3+CD8+) (Fig. 8B, D and E, S22a-S22b), which revealed that CC@LPF could sensitize α-PDL1 therapy. Besides, the infiltration of cytotoxic CD8+ T cell significantly increased in the CC@LPF group compared to CP or CQ mono-treatment. Thus, CC@LPF was a promising candidate to boost the tumor immunotherapy.
Ki-67, defined as a nuclear protein primarily related to proliferating cells, and functionally related to cell mitosis, can reflect the activity level of tumor cell proliferation. IHC staining results demonstrated that Ki67 expression in CC@LPF treatment group significantly decreased compared to either CP@LPF or CQ@LPF treatment group, further suggesting the advantage of the joint use of CP and CQ. PD-L1 ICB antibody, α-PDL1, alone presenting no decline of Ki67 expression, but would markedly reinforce CC@LPF elicited Ki67 inhibition (Fig. 8F and G). Besides, the morphology of organ and tumor tissue sections in seven groups of mouse models was studied through H&E staining (Fig. 8H and S23). It was obviously displayed nuclear atypia and inferior staining of chromatin for CC@LPF treatment relative to either CP@LPF or CQ@LPF treatment, though both of which showed certain degree of anti-tumor effect. α-PDL1, alone presenting no obvious histological change, however, CC@LPF + α-PDL1 resulted in more significant nuclear atypia and inferior staining relative to CC@LPF treatment alone (Fig. 8H). The changes in cell integrity and tissue morphology of the main organs in different treatment groups could be negligible (Fig. 8H and S23). These results demonstrated that CC@LPF potentiated as tumor therapy agents exhibiting the capabilities of tumor cell killing and synergistic tumor therapy with ICB.

The mechanism of the in vivo joint anti-tumor efficiency of CC@LPF and ICB. (A) Flow cytometric analysis of the populations of CD11C+ MHC-II+ DCs in tumor environment after would not obviously affect the level. (B) CD3, CD8 IHC staining of tumor tissue sections obtained from tumor-bearing mice after various treatments. H, hematoxylin. (C) The percentages of MHC-II+ DCs from CD11c+ DCs in tumor microenvironment. n ≥ 4. (D-E) Flow cytometric analysis of the populations of CD3+ and CD3+ CD8+ T cells in TME after the different treatments. n ≥ 4 (F) Quantification of Ki67 positive area in tumors. n = 3. The corresponding statistical analysis were performed by Image J software. (G) Ki-67 IHC staining of tumor tissue sections obtained from tumor-bearing mice with various treatments. H, hematoxylin. (H) Pathological analysis of the vital organs including kidney, lung, liver and tumor gathered from CT26 tumor loaded mice after different treatments by H&E staining
Conclusions
In the present study, the as-synthesized copper peroxide (CP) nanoparticles, presenting a morphology of date stone, were demonstrated to induce autophagy flux. However, autophagy induced by CP exhibited no cancer cell fate decision. Intriguingly, both in vitro and in vivo study indicated a combined administration of CP and chloroquine demonstrated a synergistic tumor cell growth inhibition of CP and CQ, which is independent on autophagy. Further study illustrated that the joint use of CP and chloroquine induced robust reactive oxygen species (ROS) generation, which was responsible for synergistic tumor inhibition. Mechanistically, upregulation of endogenous copper by CQ and supplementation of exogenous copper by CP synergistically elicit a robust reactive oxygen species (ROS) generation. Besides, the hydrogen peroxide released from CP in response to the acidic environment provides sufficient substrates for Fenton catalytic reactions. On the other hand, the joint use of CP and CQ elicited an early onset, above all, a long-term high-level existence of ICD features, which is strongly associated with ROS generation and autophagosome accumulation. Due to the specific combination of folate with folate receptor overexpressed on the surface of tumor cells, CP and chloroquine co-encapsulated folate conjugated liposome nanosystem (CC@LPF) was constructed, and demonstrated a more effective tumor uptake. In vitro study illustrated that CC@LPF possessed higher tumor uptake efficacy and induced higher ROS generation plus tumor cell toxicity. Further study indicated Tumor targeting liposomal delivery of CP and CQ presented selective tumor cell growth inhibition and circumvented CP induced hemolysis. In vivo tumor targeting property of CC@LPF was also further investigated. Lastly, CC@LPF was verified as a potential tumor therapy agent exhibiting the capabilities of direct tumor cell killing and synergistic tumor therapy with the immunocheckpoint inhibitors.
Data availability
The datasets and materials used in the study are available from the corresponding author.
References
Galluzzi L, Vitale I, Warren S, Adjemian S, Agostinis P, Martinez AB, Chan TA, Coukos G, Demaria S, Deutsch E, et al. Consensus guidelines for the definition, detection and interpretation of immunogenic cell death. J Immunother Cancer. 2020;8(1):e000337.
Galluzzi L, Buqué A, Kepp O, Zitvogel L, Kroemer G. Immunogenic cell death in cancer and infectious disease. Nat Rev Immunol. 2017;17:97–111.
Galluzzi L, Humeau J, Buqué A, Zitvogel L, Kroemer G. Immunostimulation with chemotherapy in the era of immune checkpoint inhibitors. Nat Rev Clin Oncol. 2020;17:725–41.
Kroemer G, Galassi C, Zitvogel L, Galluzzi L. Immunogenic cell stress and death. Nat Immunol. 2022;23:487–500.
Petroni G, Buqué A, Zitvogel L, Kroemer G, Galluzzi L. Immunomodulation by targeted anticancer agents. Cancer Cell. 2021;39:310–45.
Costa-Mattioli M, Walter P. The integrated stress response: from mechanism to disease. Science. 2020;368(6489):eaat5314.
Bezu L, Sauvat A, Humeau J, Gomes-da-Silva LC, Iribarren K, Forveille S, Garcia P, Zhao L, Liu P, Zitvogel L, et al. eIF2α phosphorylation is pathognomonic for immunogenic cell death. Cell Death Differ. 2018;25:1375–93.
Butterfield LH, Najjar YG. Immunotherapy combination approaches: mechanisms, biomarkers and clinical observations. Nat Rev Immunol. 2023. https://doi.org/10.1038/s41577-023-00973-8.
Zhang Y, Zhang Z. The history and advances in cancer immunotherapy: understanding the characteristics of tumor-infiltrating immune cells and their therapeutic implications. Cell Mol Immunol. 2020;17:807–21.
Huang AC, Zappasodi R. A decade of checkpoint blockade immunotherapy in melanoma: understanding the molecular basis for immune sensitivity and resistance. Nat Immunol. 2022;23:660–70.
Johnson DB, Chandra S, Sosman JA. Immune checkpoint inhibitor toxicity in 2018. JAMA. 2018;320:1702–3.
Naimi A, Mohammed RN, Raji A, Chupradit S, Yumashev AV, Suksatan W, Shalaby MN, Thangavelu L, Kamrava S, Shomali N, et al. Tumor immunotherapies by immune checkpoint inhibitors (ICIs); the pros and cons. Cell Commun Signal. 2022;20(1):44.
Sharma P, Allison JP. The future of immune checkpoint therapy. Science. 2015;348:56–61.
Jeong SD, Jung BK, Ahn HM, Lee D, Ha J, Noh I, Yun CO, Kim YC. Immunogenic cell death inducing Fluorinated Mitochondria-Disrupting Helical Polypeptide synergizes with PD-L1 Immune Checkpoint Blockade. Adv Sci (Weinh). 2021;8:2001308.
Deng W, Shang H, Tong Y, Liu X, Huang Q, He Y, Wu J, Ba X, Chen Z, Chen Y, Tang K. The application of nanoparticles-based ferroptosis, pyroptosis and autophagy in cancer immunotherapy. J Nanobiotechnol. 2024;22(1):97.
Patel SA, Minn AJ. Combination Cancer Therapy with Immune Checkpoint Blockade: mechanisms and strategies. Immunity. 2018;48:417–33.
Tang Z, Liu Y, He M, Bu W. Chemodynamic therapy: Tumour Microenvironment-Mediated Fenton and Fenton-like reactions. Angew Chem Int Ed Engl. 2019;58:946–56.
Tang Z, Zhao P, Wang H, Liu Y, Bu W. Biomedicine meets Fenton Chemistry. Chem Rev. 2021;121:1981–2019.
Bokare AD, Choi W. Review of iron-free Fenton-like systems for activating H2O2 in advanced oxidation processes. J Hazard Mater. 2014;275:121–35.
Cairns RA, Harris IS, Mak TW. Regulation of cancer cell metabolism. Nat Rev Cancer. 2011;11:85–95.
Doskey CM, Buranasudja V, Wagner BA, Wilkes JG, Du J, Cullen JJ, Buettner GR. Tumor cells have decreased ability to metabolize H(2)O(2): implications for pharmacological ascorbate in cancer therapy. Redox Biol. 2016;10:274–84.
Zhaoyou C, Juan Y, Wang Z, Jiangwei S, Wanni W, Haisheng Q. Recent advances on modulation of H2O2 in tumor microenvironment for enhanced cancer therapeutic efficacy. Coord Chem Rev. 2023;481:215049.
Lin LS, Huang T, Song J, Ou XY, Wang Z, Deng H, Tian R, Liu Y, Wang JF, Liu Y, et al. Synthesis of copper peroxide nanodots for H(2)O(2) self-supplying Chemodynamic Therapy. J Am Chem Soc. 2019;141:9937–45.
Liu B, Bian Y, Liang S, Yuan M, Dong S, He F, Gai S, Yang P, Cheng Z, Lin J. One-step integration of Tumor Microenvironment-Responsive Calcium and Copper Peroxides Nanocomposite for enhanced Chemodynamic/Ion-Interference therapy. ACS Nano. 2022;16:617–30.
Hou S, Gao Y-E, Ma X, Lu Y, Li X, Cheng J, Wu Y, Xue P, Kang Y, Guo M, Xu Z. Tumor microenvironment responsive biomimetic copper peroxide nanoreactors for drug delivery and enhanced chemodynamic therapy. Chem Eng J. 2021;416:129037.
Li Z, Wang C, Dai C, Hu R, Ding L, Feng W, Huang H, Wang Y, Bai J, Chen Y. Engineering dual catalytic nanomedicine for autophagy-augmented and ferroptosis-involved cancer nanotherapy. Biomaterials. 2022;287:121668.
Lee JY, Kim JS, Park JC, Nam YS. Protein–quantum dot nanohybrids for bioanalytical applications. WIREs Nanomed Nanobiotechnol. 2015;8:178–90.
Liu F, He T, Gong S, Shen M, Ma S, Huang X, Li L, Wang L, Wu Q, Gong C. A tumor pH-responsive autocatalytic nanoreactor as a H(2)O(2) and O(2) self-supplying depot for enhanced ROS-based chemo/photodynamic therapy. Acta Biomater. 2022;154:510–22.
Deng H, Yang Z, Pang X, Zhao C, Tian J, Wang Z, Chen X. Self-sufficient copper peroxide loaded pKa-tunable nanoparticles for lysosome-mediated chemodynamic therapy. Nano Today. 2022;42:101337.
Cramer SL, Saha A, Liu J, Tadi S, Tiziani S, Yan W, Triplett K, Lamb C, Alters SE, Rowlinson S, et al. Systemic depletion of L-cyst(e)ine with cyst(e)inase increases reactive oxygen species and suppresses tumor growth. Nat Med. 2016;23:120–7.
Noh J, Kwon B, Han E, Park M, Yang W, Cho W, Yoo W, Khang G, Lee D. Amplification of oxidative stress by a dual stimuli-responsive hybrid drug enhances cancer cell death. Nat Commun. 2015;6:6907.
Gaetke LM, Chow CK. Copper toxicity, oxidative stress, and antioxidant nutrients. Toxicology. 2003;189:147–63.
Chen L, Min J, Wang F. Copper homeostasis and cuproptosis in health and disease. Signal Transduct Target Ther. 2022;7:378.
Woźniak-Budych MJ, Staszak K, Staszak M. Copper and copper-based nanoparticles in Medicine-perspectives and challenges. Molecules. 2023;28(18):6687.
Zuo H, Tao J, Shi H, He J, Zhou Z, Zhang C. Platelet-mimicking nanoparticles co-loaded with W(18)O(49) and metformin alleviate tumor hypoxia for enhanced photodynamic therapy and photothermal therapy. Acta Biomater. 2018;80:296–307.
Huang H, Zhang C, Wang X, Shao J, Chen C, Li H, Ju C, He J, Gu H, Xia D. Overcoming hypoxia-restrained Radiotherapy using an erythrocyte-inspired and glucose-activatable platform. Nano Lett. 2020;20:4211–9.
Zetrini AE, Lip H, Abbasi AZ, Alradwan I, Ahmed T, He C, Henderson JT, Rauth AM, Wu XY. Remodeling Tumor Immune Microenvironment by using polymer-lipid-manganese Dioxide nanoparticles with Radiation Therapy to Boost Immune response of castration-resistant prostate Cancer. Research (Wash D C) 2023, 6:0247.
Zhang C, Xia D, Liu J, Huo D, Jiang X, Hu Y. Bypassing the immunosuppression of myeloid-derived suppressor cells by reversing Tumor Hypoxia using a platelet-inspired platform. Adv Funct Mater. 2020;30:2000189.
Yao H, Zhang Y, Liu L, Xu Y, Liu X, Lin J, Zhou W, Wei P, Jin P, Wen LP. Inhibition of lanthanide nanocrystal-induced inflammasome activation in macrophages by a surface coating peptide through abrogation of ROS production and TRPM2-mediated ca(2+) influx. Biomaterials. 2016;108:143–56.
Aman Y, Schmauck-Medina T, Hansen M, Morimoto RI, Simon AK, Bjedov I, Palikaras K, Simonsen A, Johansen T, Tavernarakis N, et al. Autophagy in healthy aging and disease. Nat Aging. 2021;1:634–50.
Debnath J, Gammoh N, Ryan KM. Autophagy and autophagy-related pathways in cancer. Nat Rev Mol Cell Biol. 2023;24:560–75.
Zhang Y, Zhang L, Gao J, Wen L. Pro-death or pro-survival: contrasting paradigms on Nanomaterial-Induced Autophagy and exploitations for Cancer Therapy. Acc Chem Res. 2019;52:3164–76.
Elshazly AM, Wright PA, Xu J, Gewirtz DA. Topoisomerase I poisons-induced autophagy: Cytoprotective, cytotoxic or non-protective. Autophagy Rep. 2023;2:1–16.
Wei PF, Jin PP, Barui AK, Hu Y, Zhang L, Zhang JQ, Shi SS, Zhang HR, Lin J, Zhou W, et al. Differential ERK activation during autophagy induced by europium hydroxide nanorods and trehalose: maximum clearance of huntingtin aggregates through combined treatment. Biomaterials. 2015;73:160–74.
Mauthe M, Orhon I, Rocchi C, Zhou X, Luhr M, Hijlkema KJ, Coppes RP, Engedal N, Mari M, Reggiori F. Chloroquine inhibits autophagic flux by decreasing autophagosome-lysosome fusion. Autophagy. 2018;14:1435–55.
Hu Y, Zhang HR, Dong L, Xu MR, Zhang L, Ding WP, Zhang JQ, Lin J, Zhang YJ, Qiu BS, et al. Enhancing tumor chemotherapy and overcoming drug resistance through autophagy-mediated intracellular dissolution of zinc oxide nanoparticles. Nanoscale. 2019;11:11789–807.
Peynshaert K, Manshian BB, Joris F, Braeckmans K, De Smedt SC, Demeester J, Soenen SJ. Exploiting intrinsic nanoparticle toxicity: the pros and cons of nanoparticle-induced autophagy in biomedical research. Chem Rev. 2014;114:7581–609.
Xu M, Hu Y, Ding W, Li F, Lin J, Wu M, Wu J, Wen LP, Qiu B, Wei PF, Li P. Rationally designed rapamycin-encapsulated ZIF-8 nanosystem for overcoming chemotherapy resistance. Biomaterials. 2020;258:120308.
Lin J, Huang Z, Wu H, Zhou W, Jin P, Wei P, Zhang Y, Zheng F, Zhang J, Xu J, et al. Inhibition of autophagy enhances the anticancer activity of silver nanoparticles. Autophagy. 2014;10:2006–20.
Sarkar S, Perlstein EO, Imarisio S, Pineau S, Cordenier A, Maglathlin RL, Webster JA, Lewis TA, O’Kane CJ, Schreiber SL, Rubinsztein DC. Small molecules enhance autophagy and reduce toxicity in Huntington’s disease models. Nat Chem Biol. 2007;3:331–8.
Wu YT, Tan HL, Shui G, Bauvy C, Huang Q, Wenk MR, Ong CN, Codogno P, Shen HM. Dual role of 3-methyladenine in modulation of autophagy via different temporal patterns of inhibition on class I and III phosphoinositide 3-kinase. J Biol Chem. 2010;285:10850–61.
Otomo C, Metlagel Z, Takaesu G, Otomo T. Structure of the human ATG12 ~ ATG5 conjugate required for LC3 lipidation in autophagy. Nat Struct Mol Biol. 2013;20:59–66.
Yang F, Medik Y, Li L, Tian X, Fu D, Brouwer KLR, Wagner K, Sun B, Sendi H, Mi Y, Wang AZ. Nanoparticle Drug Delivery can reduce the hepatotoxicity of therapeutic Cargo. Small. 2020;16:e1906360.
Eng CH, Wang Z, Tkach D, Toral-Barza L, Ugwonali S, Liu S, Fitzgerald SL, George E, Frias E, Cochran N, et al. Macroautophagy is dispensable for growth of KRAS mutant tumors and chloroquine efficacy. Proc Natl Acad Sci U S A. 2016;113:182–7.
Maes H, Kuchnio A, Peric A, Moens S, Nys K, De Bock K, Quaegebeur A, Schoors S, Georgiadou M, Wouters J, et al. Tumor vessel normalization by chloroquine independent of autophagy. Cancer Cell. 2014;26:190–206.
Maycotte P, Aryal S, Cummings CT, Thorburn J, Morgan MJ, Thorburn A. Chloroquine sensitizes breast cancer cells to chemotherapy independent of autophagy. Autophagy. 2012;8:200–12.
Tsvetkov P, Coy S, Petrova B, Dreishpoon M, Verma A, Abdusamad M, Rossen J, Joesch-Cohen L, Humeidi R, Spangler RD, et al. Copper induces cell death by targeting lipoylated TCA cycle proteins. Science. 2022;375:1254–61.
Huang L, Hou FP, Xi P, Bai D, Xu M, Li Z, Xie G, Shi Y, Liu H, Zeng Z. A rhodamine-based turn-on fluorescent chemodosimeter for Cu2 + and its application in living cell imaging. J Inorg Biochem. 2011;105:800–5.
Ge EJ, Bush AI, Casini A, Cobine PA, Cross JR, DeNicola GM, Dou QP, Franz KJ, Gohil VM, Gupta S, et al. Connecting copper and cancer: from transition metal signalling to metalloplasia. Nat Rev Cancer. 2022;22:102–13.
Manning TJ, Leggett T, Jenkins D, Furtado I, Phillips D, Wylie G, Bythell BJ, Zhang F. Structural and some medicinal characteristics of the copper(II)-hydroxychloroquine complex. Bioorg Med Chem Lett. 2013;23:4453–8.
Jelinek A, Heyder L, Daude M, Plessner M, Krippner S, Grosse R, Diederich WE, Culmsee C. Mitochondrial rescue prevents glutathione peroxidase-dependent ferroptosis. Free Radic Biol Med. 2018;117:45–57.
Zhang Y, Du X, He Z, Gao S, Ye L, Ji J, Yang X, Zhai G. A vanadium-based nanoplatform synergizing ferroptotic-like therapy with glucose metabolism intervention for enhanced Cancer Cell Death and Antitumor Immunity. ACS Nano. 2023;17:11537–56.
Zhang Z, Bai L, Hou L, Deng H, Luan S, Liu D, Huang M, Zhao L. Trends in targeting Bcl-2 anti-apoptotic proteins for cancer treatment. Eur J Med Chem. 2022;232:114184.
Oakes SA, Papa FR. The role of endoplasmic reticulum stress in human pathology. Annu Rev Pathol. 2015;10:173–94.
Jia C, Guo Y, Wu FG. Chemodynamic therapy via Fenton and Fenton-Like nanomaterials: strategies and recent advances. Small. 2022;18:e2103868.
Du B, Jiang X, Das A, Zhou Q, Yu M, Jin R, Zheng J. Glomerular barrier behaves as an atomically precise bandpass filter in a sub-nanometre regime. Nat Nanotechnol. 2017;12:1096–102.
Cen D, Ge Q, Xie C, Zheng Q, Guo J, Zhang Y, Wang Y, Li X, Gu Z, Cai X. ZnS@BSA Nanoclusters Potentiate Efficacy of Cancer Immunotherapy. Adv Mater. 2021;33:e2104037.
Gogoi M, Ravikumar V, Dixit NM, Chakravortty D. Salmonella escapes antigen presentation through K63 ubiquitination mediated endosomal proteolysis of MHC II via modulation of endosomal acidification in dendritic cells. Pathog Dis. 2018;76(2):ftx125.
Shin JS, Ebersold M, Pypaert M, Delamarre L, Hartley A, Mellman I. Surface expression of MHC class II in dendritic cells is controlled by regulated ubiquitination. Nature. 2006;444:115–8.
Garulli B, Stillitano MG, Barnaba V, Castrucci MR. Primary CD8 + T-cell response to soluble ovalbumin is improved by chloroquine treatment in vivo. Clin Vaccine Immunol. 2008;15:1497–504.
Zamame Ramirez JA, Romagnoli GG, Falasco BF, Gorgulho CM, Sanzochi Fogolin C, Dos Santos DC, Junior JPA, Lotze MT, Ureshino RP, Kaneno R. Blocking drug-induced autophagy with chloroquine in HCT-116 colon cancer cells enhances DC maturation and T cell responses induced by tumor cell lysate. Int Immunopharmacol. 2020;84:106495.
Funding
This work was financially supported by Taishan Scholars Program of Shandong Province (tsqn202103112; tstp20221145), the National Natural Science Foundation of China (T2222014), the Development Plan of Youth Innovation Team in Colleges and Universities of Shandong Province (2021KJ052; 2019KJE013), the Supporting Fund for Leading Talents above Provincial Level in Yantai, the Major Basic Research Project of Shandong Provincial Natural Science Foundation (ZR2019ZD27), Key research and development program of shandong province(2023CXPTO12), Yantai Science and Technology Innovation Development Plan Project (2023JCYJ072), the Collaborative Innovation Program of Hefei Science Center, CAS (2022HSC-CIP012).
Author information
Authors and Affiliations
Contributions
PFW, GT, YZ, and ZW designed this study. DS, GW, PW and LY prepared materials and carried out the corresponding characterization. YX, JZ, GZ and NW carried out the cell and the animal experiments. DS, GW, LY, YX, and JZ also performed some animal experiments. PFW, DS and GW are all responsible for writing the manuscript. Correspondence and requests for materials should be addressed to PFW, GT and ZW.
Corresponding authors
Ethics declarations
Competing interests
The authors declare no competing interests.
Additional information
Publisher’s Note
Springer Nature remains neutral with regard to jurisdictional claims in published maps and institutional affiliations.
Electronic supplementary material
Below is the link to the electronic supplementary material.
Rights and permissions
Open Access This article is licensed under a Creative Commons Attribution-NonCommercial-NoDerivatives 4.0 International License, which permits any non-commercial use, sharing, distribution and reproduction in any medium or format, as long as you give appropriate credit to the original author(s) and the source, provide a link to the Creative Commons licence, and indicate if you modified the licensed material. You do not have permission under this licence to share adapted material derived from this article or parts of it. The images or other third party material in this article are included in the article’s Creative Commons licence, unless indicated otherwise in a credit line to the material. If material is not included in the article’s Creative Commons licence and your intended use is not permitted by statutory regulation or exceeds the permitted use, you will need to obtain permission directly from the copyright holder. To view a copy of this licence, visit http://creativecommons.org/licenses/by-nc-nd/4.0/.
About this article

Cite this article
Sun, D., Yu, L., Wang, G. et al. Rationally designed catalytic nanoplatform for enhanced chemoimmunotherapy via deploying endogenous plus exogenous copper and remodeling tumor microenvironment. J Nanobiotechnol 22, 551 (2024). https://doi.org/10.1186/s12951-024-02696-x
Received:
Accepted:
Published:
DOI: https://doi.org/10.1186/s12951-024-02696-x