
Abstract
In this chapter, we present the technological background needed for understanding the problem addressed by this DataBio pilot. Spain has to face plagues and diseases affecting forest species, like Quercus ilex, Quercus suber or Eucaliptus sp. Consequently, Spanish Public Administrations need updated information about the health status of forests. This chapter explains the methodology created based on remote sensing images (satellite + aerial + Remotely Piloted Aircraft Systems (RPAS)) and field data for monitoring the mentioned forest status. The work focused on acquiring data for establishing the relationships between RPAS generated data and field data, and on the creation of a correlation model to obtain a prospection and prediction algorithm based on spectral data for early detection and monitoring of decaying trees. Those data were used to establish the links between EO image-derived indexes and biophysical parameters from field data allowing a health status monitoring for big areas based on EO information. This solution is providing Public Administrations with valuable information to help decision making.
You have full access to this open access chapter, Download chapter PDF
Keywords
1 Introduction, Motivation, and Goals
Spain has to face worrying situations derived from plagues and diseases that are affecting forest species, like Quercus ilex, Quercus suber or Eucaliptus sp, in the Iberian Peninsula, causing high economic losses.
Spanish Public Administrations and forest owners need updated information about the health status of forests to perform a sustainable and suitable forest management. The optimal combination of different Earth observation (EO) data and field data allows the creation of new products for forest monitoring and effective tools for decision making with a good balance between results obtained and cost of use.
Therefore, the goal of this DataBio Pilot is the creation of a methodology based on remote sensing images (satellite + aerial + Remotely Piloted Aircraft Systems (RPAS)) and field data for monitoring the health status of forests in large areas in two different scenarios. This work focused on monitoring the health of Quercus sp. forests affected by the fungus Phytophthora cinnamomi Rands and the damage in Eucalyptus plantations affected by the coleoptera Gonipterus scutellatus Gyllenhal.
Phytophthora cinnamomi severely affects several tree species, like Quercus ilex and Q. suber, in different areas in Spain (Extremadura, Andalucia, Castilla y León, Castilla La Mancha, Madrid) causing a great ecological and economic problem. Detection is currently performed on the field through direct observations or through data sampling and analysis in the laboratory.
However, big data sets as very high resolution (VHR) EO data (Orthophotos and RPAS images with visible and near infrared bands) can be used to identify dead trees and locate possible affected areas of Quercus forests and to analyze their evolution. Detailed RPAS-generated visible and multispectral images as well as field data were collected from selected sampling plots and analyzed. Those data were used to establish the links between EO image-derived indexes and biophysical parameters from field data allowing a more general health status monitoring for big areas based on EO information.
A similar approach has been used for monitoring the damage in Eucalyptus plantations caused by the Gonipterus scutellatus. In this case, the main motivation for this pilot was to develop an efficient mapping and assessment tool for monitoring and assessing the damages in order to adapt management procedures and minimize economic losses.
Gonipterus scutellatus defoliates Eucalyptus plantations severely. Eucalyptus is one of the main commercial species in the North of Spain (Galicia, Asturias, and Cantabria), where Gonipterus produces huge economic losses by impeding the development and growth of trees. Authorities (Xunta de Galicia), industrial companies from the paper sector (Empresa Nacional de Celulosas—ENCE)) and forest owners need an economic, systematic, and objective tool for affected areas identification and damage assessment, in order to adapt management and minimize economic losses.
EO images-derived vegetation indices can be used for a systematic monitoring of the health status in the selected study areas; anomalies will show areas where Gonipterus can be defoliating, which will be checked on the field, either visually or using RPAS. These two information sources will be combined to define an optimal methodology for data acquisition and analysis. The rate of defoliation must be analyzed and linked to EO data.
In both cases, those EO-based solutions are providing Public Administrations with valuable information to help decision making. The EO-based system provides forest health monitoring of big forest areas including mapping and assessment tools so Public Administrations can optimize forest management resources.
2 Pilot Setup
The work focused on acquiring data for establishing the relationships between RPAS generated data and field data, and on the creation of a correlation model to obtain a prospection and prediction algorithm based on spectral data for early detection and monitoring of decaying trees affected by Phytophthora. The general methodology applied in the pilot is very briefly summarized in Fig. 25.1

General methodology for the classification of vigour/decay status from field and multispectral data from RPAS flights
In the case of Quercus, the aim is to monitor the state of the rees in the areas of open forest, “dehesas”, in order to follow the evolution of the “seca” disease. Therefore, WHR images are required to identify the trees individually (spatial resolution <= 50 cm).
In the case of Eucaliptus, the pilot aim is the development of a conceptual model for estimating the defoliation degree at tree-level according to the user’s requirements defined by the main paper manufacturer in Spain. A simplified model at “tree level” to assess defoliation and assign treatment priorities was obtained by establishing the correlation between EO (RGB, multispectral, thermal) and field data. This model is adjusted to the criteria established by the customer. According to these criteria, the treatment against Gonipterus is only applied to trees defoliated at a degree of 10–60% (Fig. 25.2).

Maps which show the “degree of defoliation” (upper figure), and the “treatment priorities” (lower figure) at “tree level”
Results obtained so far allow to state that it is possible to assess defoliation and assign treatment priorities by using RPAS data. Nevertheless, some problems appear due to the low density of Eucalyptus crowns. In addition, the variety of the land cover makes it impossible to detect trees automatically, which is necessary for extending the model to plantation level and obtaining the risk maps.
3 Technology Used
3.1 Technology Pipeline
Data collection:
In the case of oaks, a field campaign was launched in July 2018 in Haza de la Concepción (Cáceres, Spain). We analyzed 380 ha of sparse forest (“dehesa” type), from which 100 ha were selected for data acquisition. Vegetation consisted of Quercus ilex and Quercus suber showing different degrees of affection by Phytophthora. 81 Quercus ilex trees were sampled in 9 plots. Measured parameters were: mean leaf density (measured with a specialized camera as LICOR 2200), mean leaf surface and biomass (green and dry), pigment concentration from leaves (chlorophyll and carotenes), crown and trunk morphology, health status inventory and damage assessment, analysis of soil and roots for determining the presence/absence of Phytophthora cinnamomi.
The RPAS data collected were obtained using a eBee+Footnote 1 platform with SODAFootnote 2 RGB camera Sequoia multispectral camera (Green, Red, RedEdge, and NIR bands) over the study site.
Regarding Eucaplitus, there were several field campaigns such as:
-
July 2017 > Socastro (Pontevedra, Spain). Timber company ENCE manages 14 ha. Plantation of 6–7 years old Eucaliptus globulus with crown mean size 7–10 m. Dense understory vegetation dominated by Ulex europaeus and Rosa sp. Ninety-six Eucaliptus trees were sampled in 8 plots, 12 trees per plot in the different existing strata. Measured parameters in each tree were: (i) % defoliation of the crown’s upper third (according to ENCE’s protocol); (ii) defoliation, trunk, and crown morphology (according to PLURIFOR project’s protocol); (iii) mean leaf density (measured with LICOR 2200).
-
April, 2018 > Loureza (Pontevedra, Spain). Here, ENCE manages 120 ha. Commercial plantation of 6–8 years old Eucaliptus globulus. The plantation showed very different degrees of affection by Gonipterus. In this case, 210 trees were sampled (10 trees per 21 plantation lines). Measured parameters in each tree were the same as in Socastro.
Data processing:
We calculated several spectral indexes related to vegetation activity and pigments from multispectral RPAS data: normalized difference vegetation index (NDVI), green normalized difference vegetation index (GNDVI), normalized red-green difference index (NGRDI), soil-adjusted vegetation index (SAVI), optimized soil-adjusted vegetation index (OSAVI), anthocyanin reflectance index (ARI1-ARI2), and transformed chlorophyll absorption reflectance index (TCARI).
The general data flow with VHR EO data was:
-
1.
Field campaign: acquisition of RPAS data and tree samples.
-
2.
Image processing: orthorectification, orthomosaics generation, radiometric calibration, etc. (The software used was Pix4D and specific remote sensing programs: ERDAS Image and PCI Geomatics).
-
3.
Calculation of vegetation index.
-
4.
Generation of a binary tree/non-tree mask (object-based image analysis, OBIA algorithm implemented in eCognition) from the multispectral information of the RPAS/orthophotos images.
-
5.
Extraction of statistics (minimum and maximum value, mean, mode and standard deviation) at treetop level from EO data and correlation with field data (biophysical parameters).
-
6.
Construction of the statistical model of diagnosis and extension to the study area. The goal of these models is to optimize the monitoring of health status and to guide field visit.
The general pipeline is shown in Fig. 25.3.

Monitoring health pipeline
MADchangeFootnote 3 is a DataBio component [1] that detects change over time in multi- or hyper-spectral data as acquired from space or airborne scanners and it has been used as a validating system for the results obtained in specific areas of the Eucalyptus areas of study.
The initial correlation model was obtained from the first campaign (100 ha) to obtain a prediction algorithm for the early detection of decaying trees affected by Phytophthora based on spectral data. The extrapolation of the algorithm to the whole area (Haza “dehesa”, 380 ha) was developed in a second stage (Fig. 25.4).

RGB (left), multispectral (center), and NDVI (right) mosaics of the study area derived from RPAS data
In the case of Eucaliptus, processing of RPAS data was complex, due to the low leaves density of Eucaliptus canopies, which makes it hard to distinguish them from the land cover. This makes the automatic extraction of crowns very difficult (Fig. 25.5).

RGB mosaic of the study area derived from RPAS data (left); detail of Eucaliptus canopies (right), where their low leaves density can be seen
Due to the previously mentioned tree density problem, this pilot has been working with images provided by airborne cameras and published by the Spanish National Geographic Institute as Spanish National Plan PNOAFootnote 4 orthophotos.
The analysis of historic RGB and NIR images to analyze the evolution of the disease impact at the study site was considered of great interest and priority in Spain. Therefore, efforts were focused on developing a methodology for the automatic/semi-automatic detection of surviving trees. The methodology should be affordable and capable of detecting dead/surviving trees on a multitemporal and regional scale.
This work was performed in collaboration with the Spanish Ministry of Agriculture and Environment MAPA (Área de Recursos Genéticos Forestales) in the framework of the “Phytophthora Working Group” coordinated by MAPA. All Spanish Autonomous Communities affected by Phythopthora participate in this Working Group, as well as research centers and universities.
The general methodology designed by DataBio and proposed to MAPA for the automatic/semi-automatic detection of surviving trees using is shown in Fig. 25.6.

General methodology proposed for the assessment and monitoring of Phythophthora in dehesas at a regional scale
The data processing steps applied were:
-
A radiometric normalization of the historic series of images with different acquisition dates to allow multi-temporal analysis. This is a highly resource-consuming process; however, the “Image Enhancer Framework” mentioned in chapter 212 was used.
-
An object-based image analysis (OBIA) algorithm for automatic/semi-automatic detection of surviving trees using aerial images was developed (see Fig. XX). This algorithm was employed for generating a mask based on the segmentation and classification of tree crowns from each image set (2009 and 2018). The OBIA algorithm uses image segmentation techniques, grouping pixels into homogeneous areas named segments or objects. This process takes into account spectral, textural, neighborhood, and shape parameters in the identification of tree canopies from multispectral RPAS images and orthophotos. In a second step, objects are classified from the vegetation indices in order to obtain a trees/no trees mask (“tree crowns mask”). This binary mask is used to define the objects of interest and extend the diagnostic model (Fig. 25.7).
Fig. 25.7 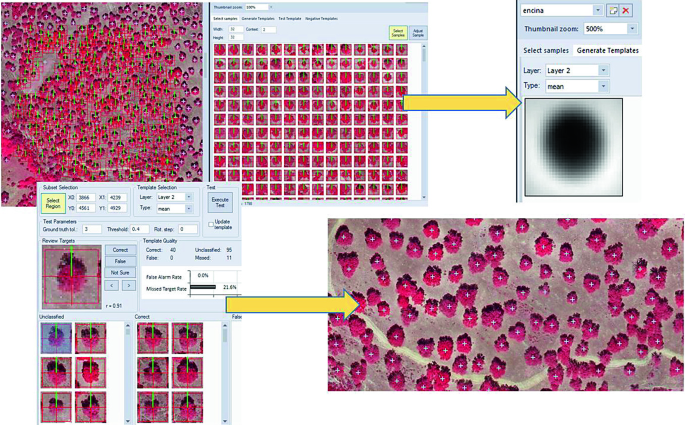
Training of the OBIA algorithm employed for the semi-automatic detection of individual trees

-
A change detection analysis among the two historic sets was performed by comparing the “tree crowns mask” from different dates (Fig. 25.8), thus allowing identification of surviving and dead trees. Finally, a shapefile was obtained containing the location of surviving/dead Quercus ilex trees in ten study areas.
Fig. 25.8 
Change detection process to identify dead/surviving Quercus ilex trees

Data visualization and presentation:
The results of this pilot are typically raster images as shown in Fig. 25.9. Those images show indexes as NDVI, for example, using a choropleth schema.

Mosaic of the study area derived from RPAS data and location of trees (upper figure); map of tree status marked with different colors (lower figure)
3.2 Data Used in the Pilot
As explained, we used massive and frequently updated data, like Earth observation data and RPAS data from different sources:
-
SENTINEL-2: Earth observation data owned by the European Space Agency (ESA).
-
Aerial Photograph or Orthophotos: Earth observation data in image format obtained from the National Geographic Institute of Spain.
-
RPAS: The RPAS data collected were obtained using a eBee+ platform with SODA camera and multispectral Sequoia camera (Green, Red, RedEdge ,and NIR bands) over the study site.
3.3 Reflection on Technology Use
Regarding RPAS and field data, the following results and conclusions have been reached:
-
Spatial resolution: it is necessary to use very high resolution (VHR) images (≤50 cm), which allow the identification of individual trees.
-
Spectral resolution: it is necessary to use information from the Infrared wavelengths, which allows to assess the status of vegetation.
-
Temporal resolution: the evolution of the disease does not require a very high temporal resolution. The update frequency of the Spanish National Plan PNOA (2–3 years), with data available from 2005, is enough.
-
A radiometric normalization process is mandatory to be able to work with RGB-NIR images with different acquisition dates in the historic database.
It can be concluded that the use of RPAS is interesting for monitoring Phytophthora outbreaks at a local scale. For big areas (the area potentially affected is the half South of the Iberian Peninsula), the use of PNOA aerial photography is proposed. These are very interesting results from the management point of view, as PNOA is a free periodic product provided by the Spanish Public Administration.
With big data tools already available, the methodology developed could be extended to a lot bigger “dehesa” areas, so that it would be possible to estimate the number of Quercus ilex trees lost in a period of time in a certain province and region. The methodology is very interesting for the periodical monitoring of the vigor status of “dehesas” (analysis of progression/regression of Quercus forests, detection of new outbreaks).
Regarding Eucalyptus damages, using RPAS & field data give results that so far allow us to state that it is possible to assess defoliation and assign treatment priorities at tree level, the low density of Eucalyptus crowns and the variety of the understory makes it impossible to automatically detect trees, so this task cannot be automated. The goal of extending the model to plantation level and obtaining risk maps has consequently not been reached.
When using Sentinel and field data, no correlation was found between Sentinel data and defoliation produced by Gonipterus.
4 Business Value and Impact
4.1 Business Impact of the Pilot
The pilot reached its defined business goals, and this was validated by a set of KPIs supporting the exploitation potential of the technology pipeline (Table 25.1).
4.2 Business Impact of the Technology on General Level
See Table 25.2.
4.3 How-to-Guideline for Practice When and How to Use the Technology
The methodologies developed by this DataBio pilot are very useful for monitoring dense forest stands; however, the utility shown when applied to scattered stands (Holm oak) or sparse trees (Eucalyptus) has been less. Therefore, this pilot can be considered a good demonstrator of the limits of current technology.
It should be noted that drone flights can be relatively expensive applied to large areas; therefore, the developed methodologies can be applied in two different ways:
-
With drone data for reduced areas (At plot level)
-
With satellite data on dense masses (at regional or national level).
5 Summary and Conclusions
The pilot explained in this chapter shows how it is possible to use field data combined with drone images to obtain relationship equations between the different pixel data and the state of health of forest stands. Once these local models are obtained, it is possible to extend them to larger areas at the regional or national level.
Also, if there is a big gap in resolution between satellite and drone data, we have seen how it is possible to design debugging and improvement methods for orthophotos.
In conclusion, the technical results have been very interesting, but the choice of species, despite its economic interest, has led us to work on the edge of Earth observation technologies.
All this information is utterly developed in DataBio public Deliverable D2.3 Forestry Pilots Final Report [2].
Notes
- 1.
- 2.
- 3.
- 4.
Plan Nacional de Ortofotografía Aérea—Aerial orthophotos National Plan.
References
DataBio Website, https://www.databio.eu/en.
DataBio public deliverable D2.3 Forestry Pilot Final Report4.1 Platform and Interfaces, https://www.databio.eu/wp-content/uploads/2017/05/DataBio_D2.3-Forestry-Pilot-Final-Report_v1.1_2020-03-04_VTT.pdf.
Acknowledgements
The authors would like to thank everybody who contributed to the work presented in this chapter. Particularly, we would like to acknowledge the inputs of Ence-Energía & Celulosa and the participation and support of TRAGSA Group Managers: Clara Alonso Fernández-Coppel, Rosario Escudero Barbero, Mariano Navarro de la Cruz, Manuel López Hernández and Luis Ocaña Bueno.
We also want to acknowledge the following organizations for their provision of open source EO and field datasets: the European Space Agency, Instituto Geográfico Nacional de España and Ministerio de Agricultura, Pesca y Alimentación (Subdirección de Política Forestal y Lucha contra la Desertificación)
Author information
Authors and Affiliations
Corresponding author
Editor information
Editors and Affiliations
Rights and permissions
Open Access This chapter is licensed under the terms of the Creative Commons Attribution 4.0 International License (http://creativecommons.org/licenses/by/4.0/), which permits use, sharing, adaptation, distribution and reproduction in any medium or format, as long as you give appropriate credit to the original author(s) and the source, provide a link to the Creative Commons license and indicate if changes were made.
The images or other third party material in this chapter are included in the chapter's Creative Commons license, unless indicated otherwise in a credit line to the material. If material is not included in the chapter's Creative Commons license and your intended use is not permitted by statutory regulation or exceeds the permitted use, you will need to obtain permission directly from the copyright holder.
Copyright information
© 2021 The Author(s)
About this chapter

Cite this chapter
Navarro, A., Checa, M.J., Lario, F., Luquero, L., Roldán, A., Estrada, J. (2021). Monitoring Forest Health: Big Data Applied to Diseases and Plagues Control. In: Södergård, C., Mildorf, T., Habyarimana, E., Berre, A.J., Fernandes, J.A., Zinke-Wehlmann, C. (eds) Big Data in Bioeconomy. Springer, Cham. https://doi.org/10.1007/978-3-030-71069-9_25
Download citation
DOI: https://doi.org/10.1007/978-3-030-71069-9_25
Published:
Publisher Name: Springer, Cham
Print ISBN: 978-3-030-71068-2
Online ISBN: 978-3-030-71069-9
eBook Packages: Biomedical and Life SciencesBiomedical and Life Sciences (R0)