
Abstract
This paper presents the development of a benchmark vertical farm that could potentially enable the sustainable development of urban and rural areas. The investigation seeks to tackle global issues linked to sustainability development goals such as zero hunger, affordable clean energy, industry innovation and infrastructure, amongst others. Vertical farms enable plant-friendly environments in urban skyscrapers through agricultural techniques, often identified as consuming large amounts of energy. These facilities could be fully embedded into urban planning as clean energy sources such as solar and wind are fully utilised. This paper scrutinises the potential for wind energy utilisation in a vertical farm with different planting corridor widths. The study also seeks to clarify the potential for energy harvesting by identifying suitable micro wind turbines installed in the façade and roof. The vertical farm prototype is elliptical and has a total height of 108 m, 80 m width, and 60 m chord. This paper studied the prototype with corridor widths of 3 m, 4 m, 5 m, and 6 m, respectively. The maximum inlet wind speed was defined as 20 m/s, and the atmospheric boundary layer condition was applied to simulate an urban wind environment and observe the aerodynamics of the farm. The results showed that the benchmark building with a corridor of 5m-width has the best potential for wind energy harvesting, particularly when the wind turbines are located on the roof.
You have full access to this open access chapter, Download conference paper PDF
Keywords
1 Introduction
As populations continue migrating to cities, energy, food, and transportation demand increases. Thus, the growing energy crisis has become a top priority concern for the government. As early as 1999, Dr. Dickson Despommier proposed the concept of urban vertical farms [1], and since then, many countries have gradually accelerated their integration into urban construction. According to past studies [2,3,4], multi-layered crop-growing platforms are used in the innovative agricultural practice known as vertical farming. This has drawn interest, due to its potential to boost crop yields per unit amount of land [5, 6], especially compared to conventional agriculture and greenhouses. Urbanisation and population growth are driving the global vertical farming market, which, in one case study, reached $5.6 billion in 2022 and is expected to exceed $35 billion by 2032 [7]. There are precedents for the ability of vertical farms established in cities to provide fruits, vegetables, and sideline products. However, there are fewer studies to confirm the wind energy potential of vertical farms. The dense arrangement and staggered distribution of building complexes lead to complicated urban turbulence and variable wind trajectories. It has been demonstrated that urban high-rise buildings have considerable potential for wind energy [8,9,10], especially for ultra-high-rise buildings over 100 m subject to high winds. However, vertical farms consume more energy than conventional field agriculture, greenhouses, and traditional commercial and residential buildings [11]. If a tall vertical farm can efficiently harvest wind energy, it could provide power for agricultural production and reduce energy loss in power transmission.
To assess the energy generation capacity of the benchmark building, we determined the wind penetration capacity of the corridor considering various widths. Simultaneously, since urban complexes have shown advantages for wind energy harvesting and transformation [12, 13], we appended a horizontal axis wind turbine (HAWT) and a vertical axis wind turbines (VAWT) on the façade and roof. The results obtained that, although the VWAT can collect wind from all wind directions, it is not as adaptable as the HWAT regarding the degree of application and energy conversion efficiency. Therefore, the HWAT is the primary type of wind turbine installed in nominal urban buildings. Furthermore, there are two main types of configurations for installing wind turbines in buildings [14]. One is the Building Mounted Wind Turbines or top-mounted wind turbines, which are located on the roof as an additional structure and are suitable for building structures of any shape. The other is building augmented wind turbines, generally installed on building façades and mounted on outward-facing extended towers. Thus, this study compares the running effects of the wind turbine placed on the surface and the roof of the vertical farm.
2 Methodology
2.1 Computational Model
The widely recognised Computational Fluid Dynamics (CFD) simulation software ANSYS Fluent is applied to calculate complex buildings’ wind traces, velocity distributions, pressures, and wind speed vectors. The design flow is shown in Fig. 1. The numerical simulation method can recreate the atmospheric boundary conditions by setting adequate boundary conditions, turbulence, inlet velocity, and other environmental parameters.

Design flow of CFD simulation.
The CFD testing model is shown in Fig. 2. The height of each floor is 5.6 m, which can accommodate indoor planting shelves and supplemental light. The model has an ellipsoid geometry with the assemble of 20 stories, giving a total height (H) of 108 m, width (W) of 80 m, and chord (B) of 60 m. The computational domain (Fig. 2b) has a height of 6H, width of 10H + W, and length of 20H + B [15, 16]. Thus, the blocking rate in the computational domain is guaranteed to be less than 3 per cent [17, 18].
To study the wind energy potential and applications of urban high-rise vertical farms, we varied the width of outdoor corridors. This space thus became an independent variable in the concept design, taking values of 3 m, 4 m, 5 m, and 6 m. Furthermore, the wind harvesting potential of the facility is bounded by an inlet maximum velocity of 20 m/s.
The location of the different arrangements of wind turbines is shown in Fig. 3. Turbine 1 has a blade diameter of 15 m, with an extended tower height of 3 m and a hub centre height of up to 86.4 m. Turbine 2 has a blade diameter of 15 m, a tubular tower height of 20 m, and a hub centre height of up to 128 m.

Schematic diagram of (a) CFD model and (b) computational domain.
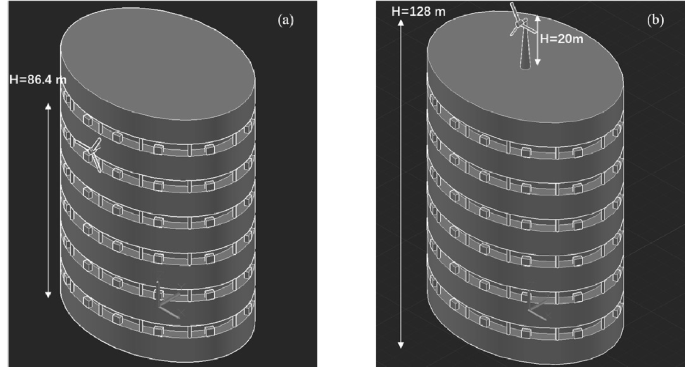
Arrangement of (a) Turbine 1 and (b) Turbine 2.
2.2 Meshing and Boundary Conditions
Coarse, base, and fine grid sizes were selected for the meshing independence test. The elements of the three grids are 1309804, 3298962, and 7404185, respectively. The results showed that for the average pressure values within the same reference area, the ratio of the difference between the values of the base grid and the other two grids is 1.3% and 0.2%, and the inaccuracy is within normal limits. Therefore, the base grid was sufficient to meet the design requirements.
The \(k-\omega \) turbulence function simulates the turbulence in the atmospheric boundary layer. When defining the pressure outlet boundary condition, the pressure of the fluid with the pressure at the flow outlet should be equalised, i.e., P = 0, where P denotes the pressure of the fluid at the outlet [19]. This boundary condition aims to enable the fluid flow at the flow outlet to satisfy the principle of conservation of mass and to ensure the accuracy and stability of the calculation results. The walls of the computational basins were calculated with symmetrical wall conditions with no slip. The solution is performed by the method of COUPLE, which allows the results to converge more quickly, 10–4 is taken as the convergence criterion.
2.3 Validation
To verify the validity of this simulation test, the surface wind pressure coefficients of the benchmark (with 5-m width) were determined, as well as the wind speeds at different heights in the basin. The comparison between the wind speeds of different heights in the basin calculated according to the mean wind speed profile and the CFD is shown in Fig. 4a. The numerical results are in good agreement with theoretical values.

(a) Theoretical and simulation wind speed in different heights of IV Terrain Category, (b) Mean wind coefficients for the vertical farm benchmark, (c) Recommended external coefficients for circular cylinders.
*The values in the brackets in Fig. 4b are resulted from Fig. 4c, and Fig. 4c is from BS EN 1991-1-4:2005 + A1:2010 - Wind actions [20].
Meanwhile, Fig. 4b shows the wind pressure coefficient values on the surface of the benchmark, which compare with those recommended by the norm BS EN 1991-1-4 for circular cylinders. This mapping was deemed necessary as neither experimental evidence of the prototype nor code recommendations for its shape and aspect ratio are currently available. Yet the comparison results are satisfactory, as presented in Fig. 4b and 4c.
3 Results
3.1 Impact of Wind Turbulence
Figure 5 shows the wind flowing past the surface of the building. We observe that the velocity on the vertical and horizontal planes located 3 m away from the windward façade and 15 m above the roof did not decrease due to the roughness of the façade. The magnitude of the value is comparable to the wind speed of the bypassing flow around the building. This indicates that the wind turbulence generated on facades mitigates at a certain distance from the farm’s surface. Therefore, wind turbines could be installed with the rotating blades protruding to avoid the turbulent boundary layer around the building envelope to maximise the performance of the wind turbines.

Diagram of velocity distribution around the vertical farm.
3.2 Impact of Corridor Width
Four separate tests were designed to investigate the influences of corridor width on wind energy harvesting. Figure 6 shows the results of the simulations via velocity vector plots in the XY plane of the models developed with the four ventilated corridor widths. Model (c) yields the most significant values of velocity and pressure in the domain. The largest wind speed reaches a value of 19.8629 m/s at both sides of the opening of the corridor, which translates into a peak wind pressure coefficient that occurs at the windward side of the building. In contrast, the lowest pressure coefficient occurs on the leeward side of it. These results show that the width of the planting corridors with openings affects the wind pressure distribution, which in turn impacts the energy harvesting of the vertical farm. Considering the wind energy side of the investigation, the 5m-wide outdoor ventilation corridor was selected as the best for energy efficiency and building sustainability.

Diagram of velocity plots in \(H=86.4\) of (a) 3-m width, (b) 4-m width, (c) 5-m width, and (d) 6-m width corridor in the vertical farm.
3.3 Impact of the Location of the Wind Turbines
The results of the wind flow streamline around the wind turbine are shown in Fig. 7, with Fig. 7a and 7b presenting the velocity vector diagram in the YZ plane. There is no backflow generated at the outlet. As the wind flows across the surface of the building, the wind speed decreases due to the blocking effect induced by the building's appearance; the more the wind approaches the surface of the building, the lower its velocity. The wind turbines (named Turbine 1 and Turbine 2, respectively) were placed on the windward side of the building at \(H = 86.4\) m which lies 3 m apart from the building façade, and on the roof, the rotating centre is at \(H= 128\) m. The Turbine 1, surrounded by a winding flow, was exposed to an average velocity of 8.7 m/s, whereas Turbine 2 was exposed to 11.2 m/s when the inlet velocity is at its limiting value of 10 m/s. This means the wind turbine has a good potential for generating electricity and can avoid the effects of turbulence caused by the vertical farm building. A certain rotational speed can be maintained at this speed to achieve uninterrupted power generation. The average value of the wind pressure coefficient is about 40.4% greater than that of Turbine 2, which means that rooftops on the vertical farm have more potential for wind energy harvesting.

Velocity and streamline plots of the vertical farm. (a) Contour of velocity plots with Turbine 1, (b) Contour of velocity plots with Turbine 2, (c) Streamline in vertical farm with Turbine 1, and (d) Streamline in vertical farm with Turbine 2.
The potential wind energy of the wind turbine can be calculated from the wind energy formula (Eq. (1)). According to Betz's Law, an ideal wind turbine's maximum wind energy utilisation factor is 0.593. Meanwhile, to compare the leading wind energy captured by wind turbines under different inlet wind speed conditions, the electricity produced by each revolution of Turbine 1 and 2 in different inlet velocities is shown in Fig. 8.
where \(E\) denotes the wind energy per unit time (KW·h), \(p\) denotes the air density (Kg/m3), \(A\) denotes the effective area of the wind turbine blades (m2), \(V\) denotes the wind speed (m/s), and \(\eta \) denotes the wind energy conversion efficiency.
In summary, the wind turbines’ electricity grows as the inlet wind velocity increases. Still, this trend does not go on forever, eventually reaching a peak and stabilising. Meanwhile, the amount of electricity the wind turbine generates varies depending on the location. The comparison of Turbines 1 and 2 shows that the roof of the vertical farm has a better ability to capture wind due to its high ventilation and air flow rate.

The electricity of one revolution of Turbine 1 and 2 in different inlet velocities.
4 Conclusion
The evidence provided in the paper allows us to conclude that the vertical farm prototype has potential for wind energy harvesting, showing sound aerodynamic performance. When the wind crosses the ventilation corridor, the airflow is compressed, and the wind speed is enhanced, especially for a corridor of 5-m width. Simultaneously, the results showed that the average wind speed around the blades on the turbine placed on the roof is higher than on the building façade, hence more efficient for generating energy. The electricity produced by each revolution of Turbine 1 and 2 in inlet velocity of 10 m/s is 0.0237 KWh and 0.0106 KWh, respectively. Thus, rooftop wind turbines in the vertical farm have better potential for capturing wind energy.
This paper is based on the results obtained from the previous literature review and CFD simulation tests; the drawback of this study is that there is no experimental demonstration, and the conclusions obtained are simulation results. Future research will use wind tunnel tests to verify the accuracy of the experimental results. The full results are in ongoing calculation procedures through wind tunnel tests.
References
Venkataraman B (2008) Country, the city version: farms in the sky gain new interest. New York Times, p 15
Kabir MSN, Reza MN, Chowdhury M, Ali M, Samsuzzaman AMR, Lee KY, Chung S-O (2023) Technological trends and engineering issues on vertical farms: a review. Horticulturae 2(9):1229
Qu CC, Sun XY, Sun WX et al (2021) Flexible wearables for plants. Small 17(50):2104482
Benis K, Reinhart C, Ferrão P (2017) Building-integrated agriculture (BIA) in urban contexts: testing: a simulation-based decision support workflow. In: Building simulation, vol 10
Beacham AM, Vickers LH, Monaghan JM (2019) Vertical farming: a summary of approaches to growing skywards. J Hortic Sci Biotechnol 94:277–283
Nájera C, Gallegos-Cedillo VM, Ros M, Pascual JA (2023) Role of spectrum-light on productivity, and plant quality over vertical farming systems: bibliometric analysis. Horticulturae 9:63
Kabir MSN, Reza MN, Chowdhury M, Ali M, Samsuzzaman AMR, Chung SO (2023) Technological trends and engineering issues on vertical farms: a review. Horticulturae 9(11):1229
Gan S, Li G, Li H (2023) Assessment of wind energy potential within through-building openings under twisted wind flows. Build Environ 244:110773
Vita G, Šarkić-Glumac A, Hemida H, Salvadori S, Baniotopoulos C (2020) On the wind energy resource above high-rise buildings. Energies 13:3641
Kumar N, Prakash O (2023) Analysis of wind energy resources from high rise building for micro wind turbine: a review. Wind Eng 47(1):190–219
Blom T, Jenkins A, Pulselli RM et al (2022) The embodied carbon emissions of lettuce production in vertical farming, greenhouse horticulture, and open-field farming in the Netherlands. J Clean Prod 377:134443
Acarer S, Uyulan Ç, Karadeniz ZH (2020) Optimization of radial inflow wind turbines for urban wind energy harvesting. Energy 202:117772
Wenhao X, Li Y, Li G, Li S, Zhang C, Wang F (2021) High-resolution numerical simulation of the performance of vertical axis wind turbines in urban area: part ii, array of vertical axis wind turbines between buildings. Renew Energy 176:25–39
Arteaga-López E, Ángeles-Camacho C, Bañuelos-Ruedas F (2019) Advanced methodology for feasibility studies on building-mounted wind turbines installation in urban environment: applying CFD analysis. Energy 167:181–188
Toja-Silva F, Peralta C, Lopez-Garcia O, Navarro J, Cruz I (2015) Roof region dependent wind potential assessment with different RANS turbulence models. J Wind Eng Ind Aerodyn 142:258–271
Lee Y-T, Lo Y-L, Juan Y-H, Li Z, Wen C-Y, Yang A-S (2023) Effect of void space arrangement on wind power potential and pressure coefficient distributions for high-rise void buildings. J Build Eng 75:107061
Badshah M, VanZwieten J, Badshah S et al (2019) CFD study of blockage ratio and boundary proximity effects on the performance of a tidal turbine. IET Renew Power Gener 13(5):744–749
Perzon S (2001) On blockage effects in wind tunnels–a CFD study. SAE Technical Paper
CFD Online. Homepage. https://www.cfd-online.com/Wiki/SST_k-omega_model. Accessed 12 Jan 2024
Standard B (2006) Eurocode 1: Actions on structures—. British Standard, United Kingdom
Acknowledgement
The financial support by the China Scholarship Council (Grant number: 202308360083) for the research of the first author, Simeng Xie, at the University of Birmingham, United Kingdom, is well acknowledged.
Author information
Authors and Affiliations
Corresponding author
Editor information
Editors and Affiliations
Rights and permissions
Open Access This chapter is licensed under the terms of the Creative Commons Attribution 4.0 International License (http://creativecommons.org/licenses/by/4.0/), which permits use, sharing, adaptation, distribution and reproduction in any medium or format, as long as you give appropriate credit to the original author(s) and the source, provide a link to the Creative Commons license and indicate if changes were made.
The images or other third party material in this chapter are included in the chapter's Creative Commons license, unless indicated otherwise in a credit line to the material. If material is not included in the chapter's Creative Commons license and your intended use is not permitted by statutory regulation or exceeds the permitted use, you will need to obtain permission directly from the copyright holder.
Copyright information
© 2024 The Author(s)
About this paper

Cite this paper
Xie, S., Martinez-Vazquez, P., Baniotopoulos, C. (2024). Wind Aerodynamics and Related Energy Potential of Urban High-Rise Vertical Farms. In: Ungureanu, V., Bragança, L., Baniotopoulos, C., Abdalla, K.M. (eds) 4th International Conference "Coordinating Engineering for Sustainability and Resilience" & Midterm Conference of CircularB “Implementation of Circular Economy in the Built Environment”. CESARE 2024. Lecture Notes in Civil Engineering, vol 489. Springer, Cham. https://doi.org/10.1007/978-3-031-57800-7_17
Download citation
DOI: https://doi.org/10.1007/978-3-031-57800-7_17
Published:
Publisher Name: Springer, Cham
Print ISBN: 978-3-031-57799-4
Online ISBN: 978-3-031-57800-7
eBook Packages: EngineeringEngineering (R0)