
Abstract
This report describes details of the requirements and practical procedures for quantitative assessments of biological functional parametric images of the brain using 123I-labeled tracers and clinical SPECT systems. With due understanding of the physics and the biological background, this is considered achievable even under clinical environments, provided that data are appropriately acquired, processed, and analyzed. This article discusses how potential hurdles have been overcome for quantitatively assessing quantitative functional parametric images in clinical settings, with successful examples that provided additional clinically useful information.
You have full access to this open access chapter, Download conference paper PDF
Keywords
1 Introduction
Current clinical practice using SPECT relies largely on the interpretation of qualitative images reflecting physiologic functions. However, a quantitative analysis could provide further information to assist in the interpretation of disease status and treatment decisions. Methodological progress has made a quantitative determination of physiological functions through imaging feasible for brain scans, including parameters like the cerebral blood flow (CBF) and cerebral flow reactivity (CFR) after pharmacological vasodilatation and also neuro-receptor functions and others. The usefulness of such data has generally been limited to research due to the logistical complexity of quantitative examinations. Extensive work has then been carried out to make quantitative study doable in clinical environments, and some relevant study protocols are today generally accepted in clinical institutions in Japan.
Statistics show that 20 % of all SPECT clinical scans, namely approximately 20,000 scans annually, are carried out for the brain, mostly on patients with neurological (67 %) and cerebral vascular diseases (33 %), which is a much larger number than in other countries. Quantitative assessments of CBF (mostly with CFR) using 123I-iodoamphetamine (IMP) comprise 5.6 % of all SPECT scans. Further, software programs assisting in the diagnosis are utilized with most brain scans, employing statistical analysis such as the 3D-SSP of Minoshima and others [1–5].
123I-IMP and other 123I-labeled tracers such as 123I-iomazenil and 123I-FP-CIT are approved for clinical use and can be employed in a quantitative analysis for demonstrating biological parametric images. Attenuation correction and scatter correction are necessary factors when conducting quantitative studies. Additional unique error of septal penetration is present when employing 123I-labeled radiopharmaceuticals.
With SPECT scans there is the advantage over PET in the availability of the necessary scanner in clinical institutions. Availability of radiopharmaceuticals is another factor which would make conducting of such clinical research simple and straightforward. Standardization of the techniques is essential to be able to generate quantitative functional images that are consistent among institutions and SPECT scanners. This is important particularly when applying diagnosis-assisting software programs, to ensure consistent results independent of the SPECT devices installed at different institutions. The ability to refer to and compare results from different institutions or databases created at different institutions also requires that quantitative and reproducible results are needed.
This article describes how an integrated system was developed to enable a quantitative assessment of images of biological functions consistent among institutions in clinical setting with 123I-labeled radiopharmaceuticals. To achieve this we describe the physics and technical background needed for the quantitation. Application and verification of the developed software packages as clinical diagnostic tools, and how users have been supported, will also be discussed for 123I-IMP, 123I-IMZ, and 123I-FP-CIT examinations.
2 Requirements for Quantitative Reconstructions in SPECT
2.1 Scatter Correction
It is commonly accepted that the scatter and attenuation occurring in an object are the two major error factors with SPECT, and these need to be compensated for in the quantitative imaging. One technique to estimate the scatter distribution is to acquire projection data for additional energy windows in addition to the main window that covers the main peak. Selecting two additional windows below and above the main peak, the so-called triple-energy window (TEW) [6] method, is a commonly applied technique, in which acquired counts of the lower and upper windows are subtracted from those of the main window, and the reconstruction is then performed using the scatter-subtracted projection data. An advantage of this technique is that the procedures automatically compensate for the photons penetrating the collimator (see below).
An alternative approach is based on estimating the scatter from the scatter-uncorrected reconstructed images using the attenuation coefficient distribution. A formulation like the Klein-Nishina formula is commonly applied to simulate the scatter projection for a given tracer distribution and is termed the single scatter simulation (SSS) method [7]. This calculation can also be performed by Monte Carlo simulation (MCS), where simplification is effective to accelerate the calculations and ensure minimal loss of accuracy [8]. One further simplified approach is also feasible, by referring to the emission and attenuation data available in the projection domain; this was originally proposed by Meikle et al. [9] and was further optimized for 99mTc [10], 201Tl [11, 12], and 123I [13] in our group. A scatter fraction is empirically defined for a radioisotope as a function of the attenuation factor, which is then used to scale the simulated scatter distribution. This is the transmission-dependent convolution subtraction (TDCS) method and is applied to the geometric mean projection data. A number of verification studies have been carried out to ensure the accuracy of this method, but it must be noted that accuracy with the SSS and MCS theoretical methods is often limited because a number of factors are not taken into account. Our earlier work by a careful Monte Carlo simulation demonstrated that a non-negligible amount of scatter originates from outside objects such as the detector and scanner itself [14] and that this may be a source of errors if not taken into account.
With the software developed by our group for quantitative SPECT reconstruction (QSPECT), we have incorporated MCS- and TDCS-based scatter correction methods, and extensive work has shown support for this in the verification of the TDCS method for brain SPECT examinations. Due to the robustness and applicability when combined with other correction procedures, all results in the following will be with the TDCS scatter correction.
2.2 Septal Penetration in the Collimator
In addition to scatter and attenuation, 123I has a further error arising from penetrating photons generated by high-energy gamma rays (>500 keV) emitted from the 123I. These penetrating photons cause a down-scatter through the collimator and escaping photons from the scintillator, resulting in non-negligible levels of bias in the energy spectrum and therefore an offset in the projection data for the selected energy window (see Fig. 2.1).

(a) Error sources which need to be compensated for in quantitative reconstruction of brain SPECT images, attenuation, scatter, and photon penetration. (b) Energy spectrum for 123I in a typical LEHR collimator. The significantly high background signal is a source of errors, caused by the high-energy photons emitted by the 123I itself
Here it must be noted that the magnitude of the offset in the projection data due to the penetrating photons varies dependent on the collimator. With typical low-energy collimator sets, this represents a large amount, due to the thin walls of such collimators, while with typical 123I-specifically designed collimator, the amount of offset is suppressed, due to thicker collimator walls. An example of a comparison of projection data obtained from two collimator sets of a typical low-energy high-resolution collimator (LEHR-para) and a 123I-specific low-medium-energy general-purpose collimator (LMEGP-para) from one vendor is shown in Fig. 2.2. Collimator penetration is clearly visible with LEHR-para, but not with LMEGP-para for a 123I-syringe and also on the striatal brain phantom (Fig. 2.2a). This difference causes the different reconstructed images of uniform cylindrical phantoms (Fig. 2.2b). It is important to note that the counts are decreased in the center of the cylindrical phantom when the attenuation correction is not applied to the data obtained with LMEGP-para collimator, while the decreased counts in the center is not visible with LEHR-para. The TEW technique is effective to compensate for the penetrating high-energy photons. With the scatter correction performed by the TEW technique, these penetrating photons are automatically compensated for. This is practical and effective, but at the expense of increased statistical noise.

(a) Typical projection data for a syringe-shaped phantom (left) and for a striatum phantom from Radiology Support Devices (Long Beach, LA, USA) (right) measured with 123I-dedicated LMEGP-para and conventional LEHR-para collimator sets. (b) Reconstructed images for a uniform cylindrical phantom filled with 123I-solution with and without attenuation correction (AC), scatter correction (SC), and photon penetration correction (PC). Different amounts of photon penetration are clearly visible as a high background outside the phantom on the projection data. In the projection data of the striatum phantom, striatum-to-whole brain ratio is also altered due to the penetrating photons. The reconstructed images also became different when not compensated. An appropriate correction procedure is important to compensate for the penetration for each set of the collimator
In the QSPECT software, the penetration component is determined empirically for a collimator, as an extension of the TDCS scatter correction, as described in an earlier report [13].
2.3 Attenuation Correction
The Chang method [15] is the most common approach for attenuation correction (AC) in brain SPECT. This method utilizes an attenuation coefficient (μ) map which is commonly generated by detecting the head contours of the reconstructed images to which the AC is applied. The μ map can also be obtained from CT or from images of other modalities. The AC factors are then estimated for each pixel as an average over the 360° views with the attenuation coefficient (μ) map and is multiplied into the non-AC reconstructed images. The Chang method is empirical but the results are considered acceptable in most brain examinations. For the quantitative reconstruction, a uniform μ map is feasible if errors < 5 % are accepted in the deep parts of the brain. However, absolute values have to be carefully defined so as to make the pixel counts of the reconstructed images independent of the size of the object. This is also the case if a CT-based μ map is utilized in the reconstruction.
2.4 Attenuation Coefficient Map
Two possibilities are given to define the attenuation μ map in QSPECT software. One is to import externally generated attenuation μ maps, typically calculated from the Hounsfield unit (HU) images generated from a CT scan. Careful attention is needed to correct for the beam hardening effects when converting the attenuation map assessed with the continuous and rather low-energy photons to the quantitative HU and μ values corresponding to photons with single energy included in the energy window. Another possibility is to generate a homogeneous μ map by detecting the head contours. Extensive efforts have been made to provide the best accuracy in the head-contour detection algorithm, and a threshold was determined from the sinogram rather than the projection or the reconstructed images, and sine wave constraint was applied to the scatter-uncorrected data when defining the edge of the sinogram. Reconstruction was made for the filtered sinogram, and a threshold was applied again to determine the head contour, ensuring that an accurate head contour is generated. An empirically defined attenuation coefficient which effectively included the contribution of the bone value was then applied [13].
An attenuation coefficient map is utilized for the attenuation correction during the OSEM procedures and also for the scatter and penetration correction prior to the reconstruction if one utilizes one of the SSS, MCS, or TDCS methods for scatter correction. This attenuation coefficient map was utilized during the OSEM procedures as well as for the scatter and penetration correction prior to the reconstruction, by using the TDCS method as discussed earlier.
2.5 Implementation of the Collimator Aperture Model
It has been shown that implementation of a collimator aperture during the forward projection process on the three-dimensional domain makes the SPECT reconstruction more accurate [16]. Effects of this are increased, resulting in improved contrast and also suppression of statistical noise. The collimator aperture model shown in Fig. 2.4 was implemented with the QSPECT reconstruction software for both the geometric mean and normal projection data. See further below.
2.6 SPECT Reconstruction
Two methods are known to quantitatively reconstruct images in the brain SPECT which will be discussed here. The filtered back projection (FBP) method is the one and has been the standard for reconstruction. For the FBP, the scatter correction has to be applied to the projection data before the reconstruction, and TEW is a well-established technique compensating for the septal penetration during the reconstruction. An attenuation correction is performed after the reconstruction in most cases based on the Chang method with an edge detection technique to generate homogeneous μ maps. The use of CT-based attenuation coefficient images is also possible, but selection of the absolute μ values needs careful consideration, and there are no published reports on how consistent results can be obtained with this technique with different equipment arrangements. A preliminary study carried out in Europe [17] showed unacceptable levels of variation and inconsistencies among sites. The reasons for the inconsistencies are unknown, but it was suggested that further careful evaluations are needed to standardize the detailed procedures. Although the FBP approach is straightforward and has been considered a standard, the method is limited when implementing new functionality to maximize the accuracy and image quality.
An alternative reconstruction method for SPECT is based on the maximum-likelihood expectation maximization (MLEM) algorithm, in which images are calculated with iterative procedures. Attenuation can be implemented in the forward projection process, so that the calculated reconstructed images are corrected for attenuation. The ordered-subset maximum-likelihood expectation maximization (OSEM) method is often utilized to accelerate convergence, as will be discussed later in this article. It must be noted that the TEW-based scatter correction includes correction also for the penetration, while currently the existing simulation-based scatter correction method does not include a penetration correction, and thus requires further development.
The QSPECT software employs the OSEM approach. A schematic representation of the process of the reconstruction in QSPECT software is shown in Fig. 2.3. Systematic errors arise due to neglecting higher μ values in the skull, but the effect is within ±5 % in the middle part of the brain and also in other areas outside the cerebral tissue [13]. The following three formulations were implemented in the program. Suitable formulation can then be selected to best fit each clinical protocol.

Diagram illustrating the quantitative reconstruction protocol implemented in the QSPECT reconstruction software. The emission data are initially reconstructed with filtered back projection (top right image) to allow the brain outline to be determined and the μ map for the attenuation correction to be determined by assigning a uniform attenuation coefficient value of 0.1603 cm−1 to the detected brain volume. The μ map is forward projected to provide the attenuation projections for the scatter correction to calculate scatter- and penetration-compensated projection. The scatter correction is carried out using TDCS method; thus, the projection data becomes geometric mean data. Then, OSEM reconstruction is applied with the attenuation correction to generate the attenuation and scatter corrected images. The collimator aperture correction (APC) can also be applied in the reconstruction process using Eq. (2.2) (Figure is from Iida et al. [28])
2.6.1 OSEM on 2D Domains for the Pre-scatter Corrected Geometric Mean Projection
The first formulation is essentially identical to the one also described in earlier studies [9–11, 13]. Reconstruction is performed for each two-dimensional tomographic slice, with the projection corrected for scatter before the reconstruction. The pixel counts of the reconstructed image \( {\lambda}_j^{n+ 1} \) are calculated from the counts of the previous image λ n j . The scatter compensated projection data by the TDCS method [18] was applied, and the formulation for the geometric mean projection data is given as follows:
where y i is the count in the projection data corrected for the scatter and the collimator penetration, c ij is a factor for the contributions from the projection pixel to the image pixel, \( \exp\;\left(-\mu {L}_i\right) \) is the net attenuation factor for each of the geometric mean projections. Note that the projection data has to be corrected before the reconstruction calculations, eg by the TDCS scatter correction.
2.6.2 OSEM on 3D Domains for the Pre-scatter Corrected Geometric Mean Projection
This formulation includes the collimator aperture correction, and the reconstruction is carried out nearly wholly in a three-dimensional domain. The scatter compensated projection data by the TDCS method [18] was applied, giving the formulation for the geometric mean projection data as follows:
where w ij represents the collimator dependent blurring of the spatial resolution shown in Fig. 2.4. Note that the projection data has to be corrected for the scatter before the reconstruction calculations as in the eq. 2.1 in which y i is the geometric mean projection data already corrected for scatter by means of the TDCS method, and c ij represents the calculation of the geometric mean.

The model for collimator aperture correction implemented in the QSPECT reconstruction software. Spatial resolution was assumed to decrease linearly with the distance from the collimator with an initial value. The contribution weights, w ij , calculated from this model were implemented in Eqs. (2.2) and (2.3), which compensated for the blurring effects due to the collimator aperture
2.6.3 OSEM on 3D Domains Including the Scatter Correction Process
This formulation includes the scatter correction process during the reconstruction as follows:
The scatter projection at the i-th iteration, s i , has to be estimated at each iteration either by the SSS or MCS methods from the i-th reconstructed images. It is also possible to use the TEW-based scattered projection for s i . In QSPECT, an accelerated MCS [8] is implemented. Consequently, y i it is not necessarily the geometric mean but may be the normal projection.
2.7 Calibration to Bq/mL
The QSPECT program is designed so that the pixel values correspond to the radioactivity concentration, the cps/mL. An experiment with a syringe filled with a 123I-labeled radioactive pharmaceutical of known radioactivity gives a calibration factor to convert the pixel counts to the absolute radioactivity concentration which has units of Bq/mL. The accuracy of the absolute quantitation was ± 10 % for 123I in uniform cylindrical phantoms provided that the diameter is less than 16 cm. For the future, this feature could be of use in internal dosimetry quantitation of radiotherapy agents such as 177Lu peptides.
2.8 Dead Time Count Loss
The counting rate performance should be sufficiently high in clinical SPECT scanners, e.g., count losses <1 % up to a counting rate of 70 kcps. This would hold for 99mTc and other commonly used SPECT radiopharmaceuticals, but may not in 123I-labeled tracers. The true counting rate of the system could be much higher than the observed rate for the given main window, attributed to the incidence of a large amount of penetrating photons originated from the high-energy gamma rays (>500 keV). Particularly, low-energy dedicated collimators such as LEHR collimators can accept large amounts of penetrating photons, and there may be a significant counting loss at counting rates much below 70kcps. Errors could be mostly in phantom experiments but may be smaller in clinical scans. It is however important to confirm the maximum counting rate that maintains the linearity of the SPECT counts to the true radioactivity.
3 Phantom Experiments
A number of studies have been carried out to evaluate the adequacy of the QSPECT reconstruction programs. The experiments were on geometrically shaped phantoms such as cylindrical phantoms and also on phantoms simulating the cerebral blood flow distribution and striatum structure with realistic head contours and skull structures. These phantom experiments are useful in validating the reconstruction procedures and also to ensure quality control of the data acquisition procedures.
3.1 Uniform Cylindrical Phantom
The cylindrical phantom gives information of how uniform images are obtained for uniform distributions of radioactivity. Image homogeneity could be degraded by several factors in relation to inappropriate corrections for attenuation, to scatter and penetration, and also to the insufficient quality control. The quality control includes the procedures for adjusting and correcting for inhomogeneous sensitivity, mistuned position linearity, misaligned center of rotation, large attenuations in the head holder, and other factors. Experiments to confirm the homogeneity for uniform phantom are highly suggested to ensure that the regional activity quantitation is not suffered from one of error factors mentioned above. However, it should be noted that inappropriate definition of the head contour and inconsistently defined attenuation coefficient values in relation to the presence of the skull may not be evaluated from the uniform cylinder phantom experiment.
3.2 3D Brain Iida Phantom for CBF Quantitation
Geometrically shaped phantoms are limited in simulating realistic head contours, the presence of the bone and trachea, and also the realistic radioactivity distribution. Therefore, dedicated brain-simulating phantoms are often desired to evaluate the overall accuracy of reconstructed images in realistic situations. We have developed a three-dimensional brain phantom (Iida phantom) that simulates the CBF distribution in cortical gray matter, with bone, trachea, and realistic head contours [19]. As shown in Fig. 2.5, accuracy of the QSPECT software can be evaluated by referring regional radioactivity concentration on the reconstructed images with those of design images of this phantom. This experiment would be useful if one wish to evaluate the accuracy of reconstructed images for multicenter clinical studies using SPECT techniques.

(Top) X-ray CT images of the developed phantom, which contain water and bone-equivalent liquid in the cortical gray matter and bone components of the phantom, (Middle) digital design of the gray matter area of the phantom after smoothing with a 16 mm full-width at half maximum Gaussian filter, and (Bottom) SPECT images of the phantom filled with 123I solution in the gray matter compartment and K2HPO4 solution in the bone compartment. All images are aligned to the digital design. The SPECT images showed good agreement with the digitally designed images. Spots shown with arrows (a–e) demonstrated are examples which indicated good agreement between the digital design and 123I-SPECT images (Figure is from Iida et al. [19])
Differences in the spatial resolution have to be assessed when comparing SPECT images acquired from different SPECT systems, because the differences in the spatial resolution causes different quantitative values due to the partial volume effect [20]. Hoffman 3D phantoms [21] was utilized to assess and to compensate for the different spatial resolution in the cerebral FDG uptake images acquired at different institutions using different PET systems on healthy volunteers [20]. The Iida brain phantom is also useful to evaluate and equalize the spatial resolution of SPECT images obtained from different sites and probably better suited to SPECT, due to its importance in the determination of head contour in SPECT scans. Yamauchi et al. [22] demonstrated that equalization of the spatial resolution significantly reduced the inter-institutional variation of the normal database of rest- and acetazolamide-CBF images among three institutions. The Iida brain phantom may be better suited than the 3D Hoffman phantom when one intends to assess attenuation or scatter-related variations among different PET/SPECT scanners.
3.3 Striatum Phantom for Dopamine Transporter Imaging
For dopamine transporter imaging using 123I-FP-CIT, a phantom simulating the striatum uptake of 123I-FP-CIT with homogeneous background in the whole brain region (Radiology Support Devices, Long beach, LA, USA) was utilized to evaluate the accuracy and also to calibrate the inter-institutional variations in multicenter evaluations in the EU [23]. The QSPECT reconstruction program was also evaluated using this phantom to assess the accuracy of the specific binding ratio (SBR) values [24], by referring the values calculated from the true radioactivity in the striatum compartments relative to the whole-brain background concentration. Results demonstrated that the SBR values measured using QSPECT software agreed well with those determined from the true radioactivity concentrations. Variation was less than 1/3 of those with FBP reconstruction including the attenuation corrections. This suggested smaller inter-institutional/inter-vendor variations less than 1/3 with QSPECT when compared with FBP. This difference corresponds to the decline of both sensitivity and specificity from 97 to 78 % in our preliminary simulation study. It is therefore of a paramount importance to establish an accurate reconstruction methodology in order to provide a good diagnostic performance in clinical settings. Further careful evaluation is to be carried out.
3.4 QSPECT Program Packages
The program package of QSPECT uses a wrapper written in JAVA to run several programs written in C language for Microsoft Windows systems and also includes programs for reconstructing SPECT images, co-registering images, re-slicing, calculating functional images, and printing summary logs. Packages are prepared for the given data processing protocols for the given radiopharmaceuticals. Of those, a package to calculate the rest- and acetazolamide-CBF images with 123I-IMP and the specific binding ratio (SBR) values with the distribution volume ratio (DVR) images with 123I-FP-CIT have been utilized to support clinical diagnosis. The programs are also utilized to support clinical research.
4 Adequacy and Impact in Clinical Scans
4.1 Dopamine Transporter Function (SBR Quantitation) Using 123I-FP-CIT
Figure 2.6 shows an example of an image of a 123I-FP-CIT scan on a young healthy volunteer (29 years old, male) acquired using a three-head SPECT camera from Toshiba (Tochigi, Japan) fitted with a LHR-fan collimator. The reconstruction was carried out according to Eq. (2.2), which includes the TDCS scatter correction for the geometric projection data and the collimator aperture correction. It can be seen that the head contour was well delineated, as indicated by the red arrows. This is attributed to the carefully designed algorithm: the contour detection with the sine function constraint on the sonogram prior to the scatter correction. With the improved sensitivity and spatial resolution achieved using the triple head SPECT camera with a fan beam collimator designed for 123I-nuclides, the collimator aperture model was effective to enhance and provide better striatum-to-background contrast with minimal enhancement of the background noise, though the SBR values essentially remained without changes. There may be lots of application areas where improved image quality can make contributions in clinical settings.

An example of an image of 123I-FP-CIT for a healthy 29-year-old male volunteer. The scan was made using the Toshiba 9300R (three-head camera) fitted with an LMEGP-fan collimator. Reconstruction was carried out according to Eq. (2.2) and includes the collimator aperture correction. The head contour is well delineated using the edge detection method implemented in the QSPECT software, as shown with the red arrows
4.2 Central Benzodiazepine Receptor Imaging Using 123I-IMZ (Neuron Damage/Residual)
The radiopharmaceutical 123I-iomazenil (IMZ) is a radiopharmaceutical approved for clinical diagnosis to assess local neuronal damage in patients with epilepsy in Japan. There are also other applications to identify the presence of neuronal damage in the prefrontal areas of patients with neurological deficits after chronic ischemia (or Moyamoya disease) and traumatic brain injuries. We have aimed to highlight significantly damaged areas using 123I-IMZ and SPECT in such patients by referring to normal patterns by means of 3D-SSP [1] [3, 5]. The challenge is to verify that identical data can be obtained from different SPECT systems installed in different institutions. Consistency is essential in order to utilize a common (normal) database rather than generating separate ones at each institution. At present, we have confirmed that a normal database for 123I-IMZ generated at two independent institutions installed with different vendor SPECT systems showed smaller variations when QSPECT with AC, SC, and PC was utilized, as compared with vendor FBP reconstruction employing AC only. It was also observed that while vendor reconstruction provided different damage regions with the 3D-SSP analysis using the normal database generated at different institutions, only small differences could be seen between two sets of the normal database with QSPECT reconstruction. This is one area where the standardization of SPECT can make a significant contribution.
4.3 Rest- and Acetazolamide-CBF Using 123I-IMP (The Dual-Table Autoradiography Method)
Extensive work has been conducted to establish and validate quantitative assessments of CBF at rest and after administration of acetazolamide with 123I-IMP and dynamic SPECT using the QSPECT program packages (Fig. 2.7). At present, the QSPECT software packages have been shown to be able to handle the data obtained from most SPECT cameras fitted with parallel beam collimators (see Table 2.1). A total of more than 60,000 scans have been carried out in Japan between 2006 and January 2015, with 16,000 scans in 2014. The scans were mainly to assess the risk of hyper-perfusion after revascularization therapy in patients who are candidates for coronary artery stents and for coronary endarterectomy.

MR and CBF images at rest and after acetazolamide stress assessed with 123I-IMP and the dual-table ARG method on two typical low-risk patients (stage I) and a patient with high-risk (stage II) ischemia (Figure is from Iida et al. [28])
The 123I-IMP has a high first-pass extraction fraction and is capable of assessing quantitative CBF values for a physiologically wide range of blood flows [25, 26]. The object was to make the quantitative assessment of the rest- and acetazolamide-CBF images from scans obtained in a single session, with two injections of 123I-IMP at 30 min intervals, to establish the ischemic status in the scans of each patient. A sophisticated compartment model was applied (called dual-table ARG) [27] to make it possible for the stress CBF images to be calculated using table look-up procedures without the need for image subtraction. This method appeared not to result in increases in statistical noise and more importantly was able to provide quantitative CBF images with minimal errors and only little inconsistency between the rest- and acetazolamide-CBF assessments. A number of studies were carried out to verify the method in clinical settings, funded by the Ministry of Health, Labour and Welfare Research Foundation from the year of 2007 for 3 years as follows:
-
(a)
There was a fairly good intra-institutional reproducibility of rest- and acetazolamide-CBF images for the same patient, approximately 10 % with 44 patients at nine institutions [28].
-
(b)
Inter-institutional reproducibility of rest- and acetazolamide-CBF images was approximately 6 % in nine patients on 18 data points [29]. An example case is shown in Fig. 2.8.
Fig. 2.8 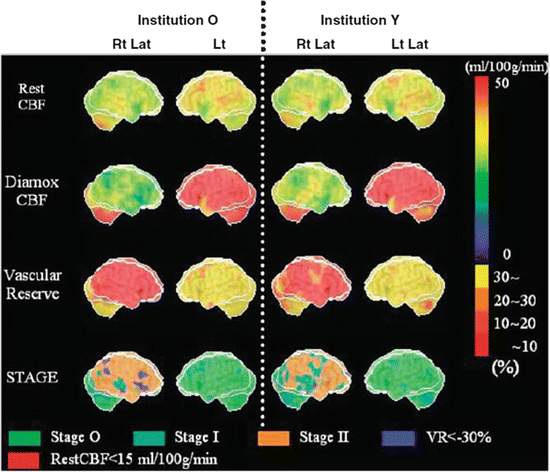
Stereotactic extraction estimates based on the JET study (SEE-JET) images [4] of a patient obtained in institutions O and Y. The Rt Lat and Lt Lat indicate the right and left hemisphere outer lateral images, respectively. Cerebral blood flow at rest (rest CBF), CBF after the acetazolamide challenge (Diamox CBF), the cerebrovascular reserve (vascular reserve), and severity of hemodynamic cerebral ischemia (STAGE) are shown as three-dimensional cerebral surface images. Images are almost visually identical, from institutions O and Y (Figure is from Yoneda et al. [29])
-
(c)
Consistent results for rest and acetazolamide CBF at rest and after acetazolamide in healthy volunteers among three institutions (a total of 32 healthy volunteers) [22].
-
(d)
Agreement with PET scan results both on relative distribution and absolute values was shown in one institution for five patients [28].

This examination is one good example that demonstrates the contribution of quantitative SPECT in clinical settings. Results of 3D-SSP shown in Fig. 2.8 are helpful in understanding the severity of ischemia and the risk status in patients with major artery occlusion or stenosis. This would also contribute to evaluate a number of therapeutic trials in the future.
5 Quality Control of the SPECT Scanner
It must be noted that standardization of the quantitative SPECT examination requires detailed self-defined protocols, including for the procedures of the administration, blood sampling, instructions to patients and patient movement, QC of SPECT devices, SPECT acquisition workflow, data pre-processing, and QSPECT reconstruction. Active feedback to deal with possible adverse events related to above procedures at clinical institutions appeared to be effective to maintain the reliability of the clinical scan findings. From July 2009 till May 2011, 139 cases were defined as potentially posing problems or possibly resulting in adverse events at 67 institutions. Claims were mostly unexpected low CFR values or unexpectedly low or high absolute CBF values. The software package was designed to keep a record of the complete calculation process, and among the data obtained in this manner, the tissue time-activity curve (tTAC) analysis for sequential short frame dynamic images and dynamic projections appeared to be helpful to identify the sources of errors. Of the 139 cases identified, 64 (42 %) did not suggest errors in the data or in the calculation process, as the observed CFR or small CBF values could be confirmed from results of the tTAC analysis, both in the dynamic reconstructed images as well as in the projection data. In other studies, the tTAC analysis was able to identify errors in the blood radioactivity concentrations (n = 26), in the cross calibration procedures (n = 25), in the IMP administration (n = 17) due to the patient motion (n = 11), and other factors including insufficient SPECT QC (n = 11). Errors in the software program were not identified in any of the studies. The feedback provided in the information to the clinical institution was evaluated to be effective to improve the quality of the examination results.
It is possible that the quality of reconstructed SPECT images is degraded by inaccurate reconstruction parameter settings in relation to the attenuation coefficients, accuracy of the head contour determination, inefficient statistical treatment, and also poor quality control (QC) of the SPECT device. It should be noted that there are no standard guidelines (like the NEMA standard) for reconstructed SPECT images, only for projection data. One contribution of the QSPECT reconstruction package is the ability to evaluate the image quality and accuracy on one domain with different systems. It was apparent that the engineers at the vendors should be encouraged to make effort to improve the quality of the reconstructed images rather than only on the projection data. Active feedback to the users at the clinical institutions is also essential to improve the quality of the examination in the quantitation. We also considered the FBP reconstruction with the scatter correction of Chang, for the scatter corrected-projection with TEW would be another possibility for standardization among different institutions. Systematic study has to be coordinated to validate the technique in multicenter settings.
6 Summary and Future Directions
The QSPECT package is able to reconstruct quantitative tomographic images from projection data acquired using commercial SPECT equipment. The adequacy was demonstrated with a series of phantom experiments. More importantly, the adequacy of images of biological functions and the use of stereotactic statistical analysis software were shown for some protocols in patient populations. Overall, this suggests the adequacy of using clinical SPECT devices for multicenter clinical studies. It is also possible to encourage the use of quantitative reconstruction with diagnosis-assisting software in clinical settings; this would enable an extension of the contribution of SPECT in evaluations of disease severity and so assist in decision making. Further systematic work should be designed to prove this concept for the various tracers in the various clinical settings.
References
Minoshima S, Frey KA, Koeppe RA, Foster NL, Kuhl DE. A diagnostic approach in Alzheimer’s disease using three-dimensional stereotactic surface projections of fluorine-18-FDG PET. J Nucl Med. 1995;36(7):1238–48. Epub 1995/07/01.
Minoshima S, Giordani B, Berent S, Frey KA, Foster NL, Kuhl DE. Metabolic reduction in the posterior cingulate cortex in very early Alzheimer’s disease. Ann Neurol. 1997;42(1):85–94. Epub 1997/07/01.
Mizumura S, Kumita S, Cho K, Ishihara M, Nakajo H, Toba M, et al. Development of quantitative analysis method for stereotactic brain image: assessment of reduced accumulation in extent and severity using anatomical segmentation. Ann Nucl Med. 2003;17(4):289–95. Epub 2003/08/23.
Mizumura S, Nakagawara J, Takahashi M, Kumita S, Cho K, Nakajo H, et al. Three-dimensional display in staging hemodynamic brain ischemia for JET study: objective evaluation using SEE analysis and 3D-SSP display. Ann Nucl Med. 2004;18(1):13–21. Epub 2004/04/10.
Ishii K, Kono AK, Sasaki H, Miyamoto N, Fukuda T, Sakamoto S, et al. Fully automatic diagnostic system for early- and late-onset mild Alzheimer’s disease using FDG PET and 3D-SSP. Eur J Nucl Med Mol Imaging. 2006;33(5):575–83. Epub 2006/02/14.
Ichihara T, Ogawa K, Motomura N, Kubo A, Hashimoto S. Compton scatter compensation using the triple-energy window method for single- and dual-isotope SPECT. J Nucl Med. 1993;34(12):2216–21. Epub 1993/12/01.
Kadrmas DJ, Frey EC, Karimi SS, Tsui BM. Fast implementations of reconstruction-based scatter compensation in fully 3D SPECT image reconstruction. Phys Med Biol. 1998;43(4):857–73. Epub 1998/05/08.
Sohlberg A, Watabe H, Iida H. Acceleration of Monte Carlo-based scatter compensation for cardiac SPECT. Phys Med Biol. 2008;53(14):N277–85. Epub 2008/06/25.
Meikle SR, Hutton BF, Bailey DL. A transmission-dependent method for scatter correction in SPECT. J Nucl Med. 1994;35(2):360–7.
Narita Y, Eberl S, Iida H, Hutton BF, Braun M, Nakamura T, et al. Monte Carlo and experimental evaluation of accuracy and noise properties of two scatter correction methods for SPECT. Phys Med Biol. 1996;41(11):2481–96.
Iida H, Eberl S. Quantitative assessment of regional myocardial blood flow with thallium-201 and SPECT. J Nucl Cardiol. 1998;5(3):313–31.
Narita Y, Iida H, Eberl S, Nakamura T. Monte Carlo evaluation of accuracy and noise properties of two scatter correction methods for 201Tl cardiac SPECT. IEEE Trans Nucl Sci. 1997;44:2465–72.
Iida H, Narita Y, Kado H, Kashikura A, Sugawara S, Shoji Y, et al. Effects of scatter and attenuation correction on quantitative assessment of regional cerebral blood flow with SPECT. J Nucl Med. 1998;39(1):181–9.
Hirano Y, Koshino K, Watabe H, Fukushima K, Iida H. Monte Carlo estimation of scatter effects on quantitative myocardial blood flow and perfusable tissue fraction using 3D-PET and (15)O-water. Phys Med Biol. 2012;57(22):7481–92. Epub 2012/10/30.
Chang L. A method for attenuation correction in radionuclide computed tomography. IEEE Trans Nucl Sci. 1978;25:638–43.
Frey EC, Tsui BMW. Collimator-detector response compensation in SPECT. In: Zaidi H, editor. Quantitative analysis in nuclear medicine imaging. Singapore: Springer US; 2006. p. 141–66.
Hapdey S, Soret M, Ferrer L, Koulibaly P, Henriques J, Bardiès M, et al. Quantification in SPECT: myth or reality ? A multicentric study. IEEE Nucl Sci Symp Conf Rec. 2004;5(3):3170–317.
Sohlberg A, Watabe H, Iida H. Three-dimensional SPECT reconstruction with transmission-dependent scatter correction. Ann Nucl Med. 2008;22(7):549–56. Epub 2008/08/30.
Iida H, Hori Y, Ishida K, Imabayashi E, Matsuda H, Takahashi M, et al. Three-dimensional brain phantom containing bone and grey matter structures with a realistic head contour. Ann Nucl Med. 2013;27(1):25–36.
Joshi A, Koeppe RA, Fessler JA. Reducing between scanner differences in multi-center PET studies. NeuroImage. 2009;46(1):154–9. Epub 2009/05/22.
Hoffman EJ, Cutler PD, Digby WM, Mazziotta JC. 3-D phantom to simulate cerebral blood flow and metabolic images for PET. IEEE Trans Nucl Sci. 1990;37:616–20.
Yamauchi M, Imabayashi E, Matsuda H, Nakagawara J, Takahashi M, Shimosegawa E, et al. Quantitative assessment of rest and acetazolamide CBF using quantitative SPECT reconstruction and sequential administration of (123)I-iodoamphetamine: comparison among data acquired at three institutions. Ann Nucl Med. 2014;28(9):836–50. Epub 2014/07/09.
Tossici-Bolt L, Dickson JC, Sera T, de Nijs R, Bagnara MC, Jonsson C, et al. Calibration of gamma camera systems for a multicentre European 123I-FP-CIT SPECT normal database. Eur J Nucl Med Mol Imaging. 2011;38(8):1529–40.
Tossici-Bolt L, Hoffmann SM, Kemp PM, Mehta RL, Fleming JS. Quantification of [123I]FP-CIT SPECT brain images: an accurate technique for measurement of the specific binding ratio. Eur J Nucl Med Mol Imaging. 2006;33(12):1491–9. Epub 2006/07/22.
Iida H, Akutsu T, Endo K, Fukuda H, Inoue T, Ito H, et al. A multicenter validation of regional cerebral blood flow quantitation using [123I]iodoamphetamine and single photon emission computed tomography. J Cereb Blood Flow Metab. 1996;16(5):781–93. Epub 1996/09/01.
Iida H, Itoh H, Nakazawa M, Hatazawa J, Nishimura H, Onishi Y, et al. Quantitative mapping of regional cerebral blood flow using iodine-123-IMP and SPECT. J Nucl Med. 1994;35(12):2019–30. Epub 1994/12/01.
Kim KM, Watabe H, Hayashi T, Hayashida K, Katafuchi T, Enomoto N, et al. Quantitative mapping of basal and vasareactive cerebral blood flow using split-dose (123)I-iodoamphetamine and single photon emission computed tomography. NeuroImage. 2006;33(3):1126–35.
Iida H, Nakagawara J, Hayashida K, Fukushima K, Watabe H, Koshino K, et al. Multicenter evaluation of a standardized protocol for rest and acetazolamide cerebral blood flow assessment using a quantitative SPECT reconstruction program and split-dose 123I-iodoamphetamine. J Nucl Med. 2010;51(10):1624–31.
Yoneda H, Shirao S, Koizumi H, Oka F, Ishihara H, Ichiro K, et al. Reproducibility of cerebral blood flow assessment using a quantitative SPECT reconstruction program and split-dose 123I-iodoamphetamine in institutions with different gamma-cameras and collimators. J Cereb Blood Flow Metab. 2012;32(9):1757–64.
Author information
Authors and Affiliations
Corresponding author
Editor information
Editors and Affiliations
Rights and permissions
Open Access This chapter is distributed under the terms of the Creative Commons Attribution-Noncommercial 2.5 License (http://creativecommons.org/licenses/by-nc/2.5/) which permits any noncommercial use, distribution, and reproduction in any medium, provided the original author(s) and source are credited.
The images or other third party material in this chapter are included in the work’s Creative Commons license, unless indicated otherwise in the credit line; if such material is not included in the work’s Creative Commons license and the respective action is not permitted by statutory regulation, users will need to obtain permission from the license holder to duplicate, adapt or reproduce the material.
Copyright information
© 2016 The Author(s)
About this paper
Cite this paper
Iida, H. et al. (2016). The Need for Quantitative SPECT in Clinical Brain Examinations. In: Kuge, Y., Shiga, T., Tamaki, N. (eds) Perspectives on Nuclear Medicine for Molecular Diagnosis and Integrated Therapy. Springer, Tokyo. https://doi.org/10.1007/978-4-431-55894-1_2
Download citation
DOI: https://doi.org/10.1007/978-4-431-55894-1_2
Published:
Publisher Name: Springer, Tokyo
Print ISBN: 978-4-431-55892-7
Online ISBN: 978-4-431-55894-1
eBook Packages: MedicineMedicine (R0)