
Abstract
The association between self-assessed cold threshold (CT) and thermal insulation of clothing (Icl) was analysed in 283 poultry workers in Thailand. The mean CT was 13.5 °C (range − 28–29) and the mean Icl was 1.23 clo (range 0.35–2.21). The adjusted CT remained unchanged at low Icls (0.35 through 1.25 clo) but was estimated to increase by 14.8 °C at high Icls (1.25 through 2.21 clo). Overall, CT was higher by 2.4 °C (95% confidence interval [CI] 0.3–3.8) at high (≥ 1.25 clo) than that at low (< 1.25 clo) Icl, but this difference was modified by personal and work-related factors. The difference was 2.6 °C (CI 0.5–4.6) for older (30–57 y) compared to younger (18–29 y) participants, with an excess of 7.3 °C (CI 5.6–9.0) for low vs high educated participants, 2.6 °C (CI 0.5–4.8) for those doing heavy vs light work, 7.4 °C (CI 3.7–11.0) for alcohol consumers vs others, and 3.4 °C (CI 0.6–6.3) for smokers vs non-smokers. The differences were independent of personal characteristics and worksite physical conditions and were interpreted as increased cold sensitivity among subgroups with lesser stamina and poorer health. Sensitive worker subgroups should be identified, and their need for cold protection should be reviewed.
Introduction
More than 80% of poultry industry workers in Thailand suffer from cold-related cardiac, respiratory, or musculoskeletal symptoms or impaired performance1,2. Moreover, cold-related symptoms can predict actual disease events and death during a longer follow-up3. The thermal insulation of protective clothing is an obvious factor underlying body cooling and the subsequent occurrence of cold-related harm. One study suggested that the prevalence of cold-related cardiorespiratory symptoms in this industry may be reduced by 20–75% through protective clothing with thermal insulation of at least 1.1 clo units4.
The basic thermal insulation of clothing among chicken industry workers in Thailand varies from 0.4–2.2 clo2. This variation reflects not only the need to wear more clothing at lower temperatures and less clothing at higher temperatures but also the variations in individual cold tolerance, with sensitive workers adding clothing earlier and at higher temperatures. However, no study has quantitatively described how thermal insulation of clothing is related to cold sensitivity in the presence of other personal and workplace factors, including ambient temperature at the worksite. This information can help customise preventive actions.
This study examined how the thermal insulation of clothing (Icl) is associated with cold sensitivity measured using a self-assessed cold threshold (CT). We adjusted for personal characteristics and physical conditions at the worksite and examined how these factors modified the association between Icl and CT. In particular, our purpose was to identify vulnerable subgroups of workers that could be targeted preventive measures. The data originate from Thailand, where outdoor temperatures range from 30 to 35 °C throughout the year; however, the food industry workers may be exposed to temperatures as low as − 20 °C. Of the total labour force of 38.7 million in Thailand, 5.9 million work in manufacturing, including the chicken meat industry5. Therefore, any improvements in cold protection will affect many workers and significantly reduce the cold-related burden in this industry.
Participants and methods
Study population
The database used in this study has been described in detail previously1. Based on power calculations, 422 workers were recruited from four chicken meat factories with altogether 13,072 workers in central and northeastern Thailand to determine the occurrence of cold-related harm. Because the availability of workers was limited by their working times, possibilities to stop working for interview, and permission given by their supervisor, we used convenience sampling based on voluntary participation. The interviews were conducted during July to November 2017. The outdoor temperature in the area ranged from 28 to 34 °C. The ambient temperature (Ta), relative humidity (RH), and air velocity (AV) were measured in the cold storage areas, manufacturing halls, and offices of the factories. This analysis was based on 283 workers with data on all relevant personal and workplace factors including Ta, RH and AV. The work involved chicken meat cutting, processing, storage, packing, and paperwork in the offices.
All procedures contributing to this work comply with the ethical standards of Mahidol University and with the Helsinki declaration of 2008. The Ethical Review Committee for Human Research, Faculty of Public Health, Mahidol University, Bangkok, Thailand, approved this study (Approval No. MUPH 2017-198). The interviewees were informed that their participation was strictly voluntary and that all information would remain confidential. All the participants provided written informed consent.
Interview
Trained interviewers conducted interviews using a structured questionnaire on personal details, living habits, work-related factors, and cold-related complaints. CT was assessed using the open question, ‘What temperature do you regard as cold (°C)?’. The interviewees were taken to the interview during the working day in no particular order. They wore their normal work clothing—no special instructions were given regarding clothing. The clothing items worn at work (28 separate items) were asked according to the ISO standard, and the basic thermal insulation of the clothing ensemble was calculated as Icl = 0.161 + 0.835 ∑ Iclu, where Iclu denotes the clo value of each clothing item6,7. The workers were instructed to indicate their job category (manufacturing, cold storage work, forklift driving, office work; classified as office work vs others), education (high: university or college; low: vocational school, high or middle school, primary school, or less), physical strain at work (heavy: medium heavy or heavy work; light: sedentary or other light work), the frequency the worker moved between cold and warmer sites (4 + times/day vs less often), and how many hours per day he/she stayed at temperatures < 0 °C. Details regarding body weight, height, smoking status (smoker vs. nonsmoker), alcohol consumption (weekly vs. less often), and brisk physical exercise during leisure time (times/week) were obtained1.
The interview also asked if the worker had perceived symptoms caused by cold temperatures in the workplace. We used five combinations of multiple symptoms: cardiorespiratory symptoms (chest pain, cardiac arrhythmias, shortness of breath, cough, wheezing, and mucus excretion), circulation symptoms (peripheral circulation symptoms, blurring of vision, and migraine), general symptoms (sleep disturbances, fatigue, thirst, and drying of mouth), finger symptoms (cold fingers, white fingers, and blue fingers), and impaired performance (concentration, motivation, endurance, handgrip force, dexterity, and holding things). These symptoms were used as concurrent standards to assess the validity of the CT.
Measurements
Ta, RH, and AV were measured close to where the workers spent most of their time. The measurement sites were cold storage (20 sites), manufacturing halls (13 sites), and offices (four sites). Ta and RH were measured using a 303 C thermo-hygrometer (Shenzhen Graigar Technology, China), and AV was measured using a VelociCalc® 9545 (TSI Incorporated, MN, USA). The technical details are provided elsewhere5.
Data analysis
The mean CTs were compared between subgroups of workers using linear regression, with CT as the response variate and Icl as the explanatory factor, adjusting for sex, age, job category, education, body mass index (BMI, kg/m2), physical work strain, smoking habits, alcohol consumption, leisure-time exercise, moving between cold and warm sites, hours spent daily at < 0 °C, and worksites Ta, RH, and AV. The first-order interactions between Icl and the explanatory factors were calculated to estimate how each factor modified the association between CT and Icl. The results were expressed as marginal means of CT, which can be interpreted as CTs adjusted for other factors in the model8,9. The differences between the classes of explanatory factors or over the entire range of continuous variables were presented as adjusted regression coefficients (badj), together with 95% confidence intervals (CIs). CT was first regressed on a linear term of Icl, then a natural cubic spline function with four degrees of freedom was fitted to describe any curvilinear association. The likelihood ratio test tested differences between linear and curved response patterns. Moving between cold and warmer sites and hours spent daily at < 0 °C were not included in the final model, as they had only a marginal effect on the adjusted CT estimates. The analysis was performed using the R software release 3.50 (https://cran.r-project.org/).
As CT is a subjective quantity that cannot be compared to any external gold standard, its concurrent validity10 was assessed by calculating how well it was predicted by cold exposure-related symptoms recorded in the same interview. Thus, the odds of elevated CT (> median 14.5 °C) was regressed on predefined sets of cold-related symptoms, adjusting for the factors included in the final model. The model-predicted occurrence of elevated CT was compared with the actual occurrence using the area under the curve (auc) function available in the pROC package in the R environment11. The auc values > 0.5 indicate that CT has some ability to classify the subjects correctly, whereas 1.0 would show a perfect performance. Three sets of cold-related symptoms were used as concurrent standards: (1) cardiorespiratory symptoms; (2) cardiorespiratory, circulation, or general symptoms; and (3) cardiorespiratory, circulation, general or finger symptoms, or impaired performance. These standards were used because cold-related cardiorespiratory symptoms can predict cardiovascular and respiratory morbidity and mortality and all-natural mortality in 18 years of follow-up3, and all symptoms used as standards were cold-related by definition1. For the symptom sets (1) to (3), the auc values were 0.64 (95% CI 0.56–0.72), 0.72 (95% CI 0.60–0.84), and 0.80 (95% CI 0.67–0.93), respectively, indicating acceptable concurrent validity.
Results
Description of participants
The average age of the participants was 32.7 years (SD, 10.2; range, 18–57 years), and 164 participants (58%) were male. Twenty-nine (10%) participants worked in offices, 137 (48%) in manufacturing halls, 87 (31%) in cold storage facilities, and 30 (11%) were forklift drivers. Moreover, 75 (27%) participants had higher education, 162 (57%) had heavy work, 235 (83%) moved between cold and warmer sites at least four times/day, and 119 (42%) spent at least 0.5 h daily at temperatures < 0°C. The average BMI was 24.1 kg/m2, and 105 (37%) workers were classified as obese (BMI ≥ 25.0 kg/m2). Ninety-three participants (33%) were smokers, 44 (16%) consumed alcohol weekly, and 121 (43%) exercised at least once per week. Altogether, 14 participants had a diagnosed cardiovascular condition (elevated blood pressure or angina pectoris), 8 had a back or joint condition, and 4 had diabetes.
Workplace physical conditions
The physical conditions of the workplace were described previously1. The mean Ta was 3.8 °C (range − 22 to 23), with 183 workers (65%) working at sites colder than 10 °C, which is defined as occupational cold based on the ISO standard12. The mean RH was 46.7% (range 27–72). AV had a skewed distribution with a long right-hand tail (median 0.35 m/s, range 0.01–3.0).
Thermal insulation of clothing
The mean Icl was similar (1.23 clo) in men and women, higher (1.26 clo) in older (30 + years) than younger workers (1.20 clo), higher in workers outside offices (1.28 clo) compared to office workers (0.81 clo), and higher in low educated (1.28 clo) than high educated (1.08 clo) workers. Slightly higher Icl was found in participants doing light vs heavy work (1.25 vs 1.18 clo, respectively), in normal weight vs obese workers (1.25 vs 1.19 clo, respectively), in those spending ≥ 0.5 h a day at temperatures < 0°C compared to others (1.27 vs 1.20, respectively). The participants who consumed alcohol 4 + times weekly had higher Icl (1.28 clo) than those consuming alcohol more rarely (1.22 clo). Differences of less than 0.03 clo were found depending on leisure-time exercise, smoking and moving between cold and warm sites during the day.
The participants working at cold sites (< 10 °C) had higher mean Icl than those working at warmer sites, with 1.27 clo and 1.17 clo, respectively, and Icl was higher at dry (RH < 41%) sites (1.29 clo) than humid sites (1.17 clo). Low AV (≤ 0.385 m/s) was associated with higher Icl (1.27 clo) than higher AV (1.19 clo).
Self-assessed CT
The mean CT was 13.5 °C (SD 10.2, range − 28 to 29). The left-hand side of Table 1 shows how plain empirical CT means vary according to personal and work-related factors. The CT was 1.1 °C higher for women than it was for men, 1.9 °C higher for more than it was for less-educated workers, 2.7 °C higher for those engaged in light vs that for those engaged in heavy work, and 2.5 °C higher for those exercising < 4 times a week compared to that experience by those exercising more frequently. Office workers showed 8.7 °C higher CT than those shown by others. The crude CTs varied by < 1 °C according to age, body weight, alcohol consumption, and smoking habits. Table 1 shows that the crude mean of CT was greater by 1.9 °C at warmer than that at colder working sites, higher by 3.4 °C at dry than humid sites, and 3.5 °C greater at draughty than those at less draughty sites.
After adjusting for personal and work-related factors, further analyses focused on the association between CT and Icl. The estimated linear increase of CT over the entire range of Icl (0.35–2.21) was 11.3 °C (CI 6.4–16.2). The likelihood ratio test comparing the linear and cubic spline models yields a p-value of approximately 0.000, indicating a significant departure from linearity. The estimated curvilinear pattern (Fig. 1) showed minimal variation in CT at clo values of less than 1.15, where CT reached its minimum (12.0 °C). However, CT increased monotonically at clo values higher than that, reaching a maximum of 26.7 °C (badj 14.8 °C [CI 0.9–28.6]) at 2.21 clo (Table 2). The 95% confidence band of the estimated CT exceeded the reference level with reasonable confidence from approximately 1.45 clo upwards. While 55.5% of the participants had insulation more than 1.15 clo, 25.8% had > 1.75 clo, and 5.3% had > 2.15 clo.
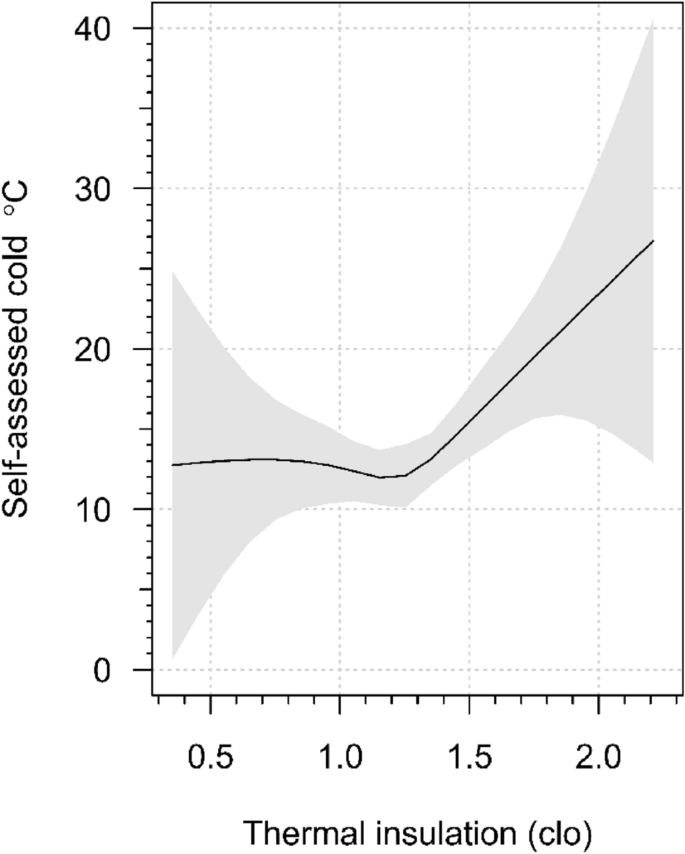
Self-assessed cold threshold (°C) according to basic thermal insulation of the clothing ensemble (clo). Estimate based on cubic spline function with 4 degrees of freedom, adjusted for sex, age, job category, education, body mass index, physical work strain, smoking, alcohol consumption, leisure-time exercise, worksite temperature, relative humidity and air velocity. Shaded area shows the 95% confidence band.
The results shown in Fig. 1 are further elaborated in the right-hand side of Table 1, which dichotomises Icl as “high” and “low”, using the median clo (1.25) as the cut-off point that coincides with the approximate location of the upturn of the response curve. The overall adjusted CT was higher by 2.4 °C (CI 0.3–3.8) among participants with higher Icl than that among participants with lower Icl (14.6 °C and 12.2 °C, respectively). However, more significant and directionally opposite variations were observed when allowance was made for interactions with the subgroups. Thus, among less-educated participants, CT increased by 3.9 °C from low to high Icl but declined by 3.4 °C among the highly educated participants, a difference of 7.3 °C due to this interaction. Among alcohol consumers, CT increased by 8.7 °C from low to high Icl, while minimal change was observed among non-consumers. Smoking in conjunction with high Icl was related to an increase of 4.6 °C in CT, while no such association was seen in non-smokers. Increases in CT between low and high Icl were observed in men, older workers, obese, those engaged in heavy work, and those who did not exercise during leisure time; the interaction effect ranged from 2 °C to 3 °C.
Discussion
Summary of findings
No study has associated high thermal insulation of clothing among cold workers with a self-assessed CT up to 15 °C higher than that associated with lower insulation, independent of actual worksite temperature and other work-related and personal factors. This finding is counterintuitive because people should wear more clothing when they feel cold, tolerate lower temperatures, and report lower CT. Therefore, we interpreted the findings in terms of clothing insulation of more than approximately 1.25 clo as a marker for cold sensitivity. Also the measured cold temperatures were associated with higher Icl. Thus, workers who are exposed to the cold suffer from cold harm, and those assessing relatively high temperatures as cold, independent of the actual temperature, also suffer from cold harm. Because oversensitivity to cold worsens quality of life, causes impaired ability to work, and decreases work satisfaction13, it is necessary to recognise cold sensitivity among cold workers. Another finding that has not been previously described is the marked variation in CT findings due to personal and work-related factors.
Previous studies on cold sensitivity
Clinical studies have reported cold sensitivity in patients with frostbites, nerve injuries, hand-arm vibration syndrome, traumatic hand injuries, and Dupuytren’s contracture14. A population-based study in northern Sweden used self-reported cold sensitivity and classified 4% of the population as cold-sensitive14. An Iranian study using the Cold Intolerance Symptom Severity Scale found that 11.5% of the general population was cold intolerant15. We found no previous studies on the prevalence of cold sensitivity in the occupational setting. There is no universally accepted definition for cold sensitivity. We, therefore, worked under the assumption that people wear more clothing at temperatures they regard as cold and observed a marked increase in CT at Icls greater than ~ 1.15 clo. One-half of the subjects wore clothing more than 1.15 clo, 25.8% more than 1.75 clo and 5.3% more than 2.15 clo, which serve as tentative cut-off points for moderate, high and very high sensitivity, respectively.
The mean CT of 13.5 °C obtained in this study cannot be directly compared to other studies. CT was based on the worker’s past perceptions of the cold in the workplace. The mean CT of 13.5 °C is within the temperature range of 10–17 °C perceived as neutral in the subarctic climate but well below the temperatures of 24–30 °C regarded as neutral in some tropical areas16 and below the recommended indoor temperature of 26 °C for Thailand17. It is also lower than 18°C, considered the lowest indoor temperature with no adverse health effects18. Thus, the overall level of self-reported CT was consistent with the previous knowledge of what is perceived as cold in tropical climates.
Interpretation of the findings
The reason for the increase in CT at higher Icl values remains unclear. One could entertain the idea that remarkably high Icl causes sweating, which decreases the insulating properties of clothing, causing a feeling of cold19. Periodic cold sensations can also be caused by rapid and large temperature fluctuations during breaks or when shuttling between cold and warm indoor spaces. Psychological factors such as fear of pain20 or negative emotions21 may affect cold tolerance; however, how they modify the self-assessed CT is unknown.
The interactions between personal and work-related factors provide further insights. Women are reportedly more sensitive to cold than men are1,5,15,22. However, this association was reversed by Icl; men with high Icl had a higher CT than that of men with low Icl, whereas no such association was observed in women. Because older individuals may have impaired thermoregulation and decreased metabolic rates23, they are expected to be more sensitive to cold, which aligns with our observation of higher CT at high Icl than that at low Icl among older workers only. Highly educated workers are reportedly more sensitive to cold than less-educated workers are, possibly because they adapt to higher temperatures in offices, and perhaps, their clothing may have been affected by fashion trends1,5,24. However, the association observed here was modified by Icl, with a much greater effect of high Icl among the less-educated workers. Obese individuals are less sensitive to cold than normal-weight individuals are because of their thicker subcutaneous fat layer and higher heat production owing to their greater lean body mass25. However, we found that among obese workers, CT increased more from low to high levels of Icl than among normal-weight workers. CT was higher at high rather than at low Icl among participants performing heavy work, whereas no difference was observed among those performing light work. Weekly alcohol consumption is related to increased cold sensitivity5 and cold-related performance problems1. This is reflected in the greater effect of high Icl among alcohol consumers, with almost no effect among non-consumers. This pattern was similar for smoking, with the effect of high Icl being greater in smokers. The pattern was mirrored with physical exercise during leisure time: CT was higher at high Icl than at low Icl, but mainly among those who did not exercise.
The subgroups identified here as cold-sensitive at high levels of Icl represent population segments known for inferior health or higher health risks. Men have poorer health than women do, as reflected by their shorter life expectancy26,27, poor health accumulates with higher ages28, less education29, obesity, smoking, alcohol consumption and lack of physical exercise30. We hypothesised that decreased stamina, related to worse health, renders specific individuals susceptible to stress caused by deviating temperatures, potentially leading them to report higher CT values.
Strengths and limitations
The strength of this study is that the participants were adapted to a hot climate and effectively revealed cold sensitivity. We also analysed the Icl–CT association by interactions to determine how personal and work-related factors modified the association, an issue not addressed in previous studies. The main limitation is self-reported CT information, a subjective quantity that cannot be compared with any external standard. Because the question on CT was clear and easily understandable and trained interviewers conducted the survey, its face validity should be reasonable. However, we do not know how it may change over time. We also compared the CT with the occurrence of cold-related cardiorespiratory symptoms, which are known to predict actual cardiorespiratory events and deaths over an extended follow-up3, as well as other symptoms associated with cold exposure1. The auc analysis showed that an elevated CT identified participants at risk of adverse cold effects reasonably well. Therefore, we believe that the reported CT reflects true perceptions of the cold in the workplace, although biases cannot be excluded in any assessment based on a concurrent standard10. The predictive validity of the question used should be ascertained in prospective studies, as we did regarding questions on cold-related symptoms3. Due to practical constraints such as the availability of workers during their regular working time, we opted to use convenience sampling. The likelihood of bias in the associations was minimised as we accounted for relevant confounders. In addition, the number of sick individuals was too small to allow us to assess the effects of medical conditions and medications on the results. However, Stjernbrandt et al.14 found no effect of medicines on cold sensitivity. One potential source of bias is vibrating tools or working machines, as vibration may lower the cold perception threshold31 but could not be controlled in this study. Further sources of bias include the inability to adjust for the menstrual phase, as women may be more sensitive to cold during the luteal phase32. It also plausible that repeated exposures to low workplace temperatures – either because of longer employment history or aging – may have caused adaptation and reduced the effects of cold33, thereby affecting clothing behaviour. Finally, the results should be extrapolated to other populations with caution because of potential variations in demographic, climatic and workplace conditions.
Conclusions
Sensitivity to cold exists among poultry workers in Thailand, as indicated by an estimated increase of CT from 12.0 °C to 26.7 °C at Icl values of 1.15 clo through 2.21 clo, respectively. We did not attempt to determine the prevalence of cold sensitivity; however, half of the participants were within the above Icl range and could be classified as having at least some cold sensitivity, both at cold and warmer working sites, independent of other workplace and personal factors. In particular, the sensitive subgroups of workers identified in this study merit further investigation. Thus workers with higher risk for poor health such as men, older workers, those with low education, alcohol consumers, smokers, obese individuals and those doing heavy work need special attention, and their cold protection should be reviewed individually. Potential actions would include adjusting workplace physical conditions by appropriate air conditioning settings, adjusting work clothing and cooling-up periods, urging workers to keep hydrated by consuming hot beverages, and subjecting sensitive workers to medical check-ups to identify cold sensitivity. Determining the individual need for cold protection and applying appropriate preventive actions are expected to reduce the cold-related burden in this industry significantly.
Data availability
The datasets generated and analyzed during the current study are not publicly available due to confidentiality reasons but are available from the corresponding author on reasonable request.
References
Auttanate, N. et al. Cold-related symptoms and performance degradation among Thai poultry industry workers with reference to vulnerable groups: A cross-sectional study. BMC Public Health 20, 1357 (2020).
Phanprasit, W. et al. Cold-related pain in the face, upper limbs, and lower body among Thai chicken industry workers: A cross-sectional study. Int. Arch. Occup. Environ. Health 94, 799–812 (2021).
Ikäheimo, T. M. et al. Cold weather-related cardiorespiratory symptoms predict higher morbidity and mortality. Environ. Res. 191, 110108 (2020).
Chotiphan, C. et al. Prevalence of cold-related symptoms among Thai chicken meat industry workers: Association with workplace temperature and thermal insulation of clothing. Ind. Health 58, 460–466 (2020).
Laohaudomchok, W. et al. Self-assessed threshold temperature for cold among poultry industry workers in Thailand. Int. J. Environ. Res. Public Health 20, 2067 (2023).
ISO 9920. Ergonomics of the Thermal Environment. Estimation of Thermal Insulation and Water Vapour Resistance of a Clothing Ensemble. International Organization for Standardization: Geneva, Switzerland (2007).
Jussila, K. et al. Thermal comfort sustained by cold protective clothing in Arctic open-pit mining—A thermal manikin and questionnaire study. Ind. Health 55, 537–548 (2007).
Bieler, G. S., Brown, G. G., Williams, R. L. & Brogan, D. J. Estimating model-adjusted risks, risk differences, and risk ratios from complex survey data. Am. J. Epidemiol. 171, 618–623 (2010).
Graubard, B. I. & Korn, E. L. Predictive margins with survey data. Biometrics 55, 652–659 (1999).
Guion, R. M. & Granny, C. J. A note on concurrent and predictive validity designs: A critical reanalysis. J. Appl. Psychol. 67, 239–244 (1982).
Robin, X. et al. pROC: An open-source package for R and S+ to analyze and compare ROC curves. BMC Bioinform. 12, 77 (2011).
ISO 15743. International Standard Organization. Ergonomics of the thermal environment. Cold workplaces. Risk assessments and management. Finnish Standards Association: Geneva, Switzerland (2008).
Carlsson, I. K., Rosén, B. & Dahlin, L. B. Self-reported cold sensitivity in normal subjects and in patients with traumatic hand injuries or hand-arm vibration syndrome. BMC Musculoskelet. Disord. 11, 89 (2010).
Stjernbrandt, A. et al. Cold sensitivity and associated factors: A nested case-control study performed in Northern Sweden. Int. Arch. Occup. Environ. Health 91, 785–797 (2018).
Khabbazi, A. et al. Cold intolerance and associated factors: A population study. Sci. Rep. 12, 18029 (2022).
Yang, W., Wong, N. H. & Zhang, G. A comparative analysis of human thermal conditions in outdoor urban spaces in the summer season in Singapore and Changsha, China. Int. J. Biometeorol. 57, 895–907 (2013).
Yamtraipat, N., Khedari, J. & Hirunlabh, J. Thermal comfort standards for air conditioned buildings in hot and humid Thailand considering additional factors of acclimatization and education level. Sol. Energy 78, 504–517 (2005).
Jevons, R., Carmichael, C., Crossley, A. & Bone, A. Minimum indoor temperature threshold recommendations for English homes in winter—A systematic review. Public Health 136, 4–12 (2016).
Rintamäki, H. & Rissanen, S. Heat strain in cold. Ind. Health 44, 427–432 (2006).
Patanwala, A. E. et al. Psychological and genetic predictors of pain tolerance. Clin. Transl. Sci. 12, 189–195 (2019).
Zvolensky, M. J., Leyro, T. M., Bernstein, A. & Vujanovic, A. A. Historical perspectives, theory, and measurement of distress tolerance. In Distress tolerance. Theory, research, and clinical applications (eds Zvolensky, M. J. et al.) 1–27 (The Guilford Press, 2010).
Kaikaew, K. et al. Sex difference in cold perception and shivering onset upon gradual cold exposure. J. Therm. Biol. 77, 137–144 (2018).
Blatteis, C. M. Age-dependent changes in temperature regulation—A mini review. Gerontology 58, 289–295 (2012).
Phanprasit, W. et al. Workplace cold and perceived work ability: Paradoxically greater disadvantage for more versus less educated poultry industry workers in Thailand. Front. Public Health 9, 762533 (2021).
Nahon, K. J. et al. Lower critical temperature and cold-induced thermogenesis of lean and overweight humans are inversely related to body mass and basal metabolic rate. J. Thermal Biol. 69, 238–248 (2017).
Mahidol University. Institute for Population and Social Research IPSR. Population statistics as of July 1, 2000. Mahidol Popul. Q. Gaz. 9, 1–2 (2000).
Salomon, J. A. et al. Healthy life expectancy for 187 countries, 1990–2010: A systematic analysis for the Global Burden Disease Study 2010. Lancet 380, 2144–2162 (2012).
Yiengprugsawan, V., Khamman, S., Seubsman, S. A., Lim, L. L. Y. & Sleigh, A. C. Social capital and health in a national cohort of 82,482 Open University adults in Thailand. J. Health Psychol. 16, 632–642 (2011).
Kunst, A. E. et al. Trends in socioeconomic inequalities in self-assessed health in 10 European countries. Int. J. Epidemiol. 34, 295–305 (2005).
Booth, F. W., Roberts, C. K. & Laye, M. J. Lack of exercise is a major cause of chronic diseases. Compr. Physiol. 8, 1143–1211 (2012).
Burström, L. et al. Acute effects of vibration on thermal perception thresholds. Int. Arch. Occup. Environ. Health 81, 603–611 (2008).
Cankar, K., Music, M. & Finderle, Z. Cutaneous microvascular response during local cold exposure—The effect of female sex hormones and cold perception. Microvasc. Res. 108, 34–40 (2016).
Cheung, S. S., Lee, J. K. W. & Oksa, J. Thermal stress, human performance, and physical employment standards. Appl. Physiol. Nutr. Metab. 41, S148–S164 (2016).
Author information
Authors and Affiliations
Contributions
W. Phanprasit, W. Laohaudomchok and S. Näyhä contributed to the acquisition and interpretation of data and drafting of the work. P. Konthonbut, S. Noomnual, S. Rissanen, K. Jussila, T.M. Ikäheimo, J.J.K. Jaakkola and S. Näyhä revised the manuscript for important intellectual content. All authors contributed to the concept of the work, approved the final version, and agreed to be accountable for all aspects of the work.
Corresponding author
Ethics declarations
Competing interests
The authors declare no competing interests.
Additional information
Publisher's note
Springer Nature remains neutral with regard to jurisdictional claims in published maps and institutional affiliations.
Rights and permissions
Open Access This article is licensed under a Creative Commons Attribution-NonCommercial-NoDerivatives 4.0 International License, which permits any non-commercial use, sharing, distribution and reproduction in any medium or format, as long as you give appropriate credit to the original author(s) and the source, provide a link to the Creative Commons licence, and indicate if you modified the licensed material. You do not have permission under this licence to share adapted material derived from this article or parts of it. The images or other third party material in this article are included in the article’s Creative Commons licence, unless indicated otherwise in a credit line to the material. If material is not included in the article’s Creative Commons licence and your intended use is not permitted by statutory regulation or exceeds the permitted use, you will need to obtain permission directly from the copyright holder. To view a copy of this licence, visit http://creativecommons.org/licenses/by-nc-nd/4.0/.
About this article

Cite this article
Phanprasit, W., Laohaudomchok, W., Konthonbut, P. et al. Self-assessed threshold for cold temperatures and thermal insulation of clothing among poultry workers. Sci Rep 14, 20406 (2024). https://doi.org/10.1038/s41598-024-71393-4
Received:
Accepted:
Published:
DOI: https://doi.org/10.1038/s41598-024-71393-4
- Springer Nature Limited