

Abstract
Background
Insomnia disorder with comorbid anxiety is a prevalent clinical challenge. Although transcranial direct current stimulation (tDCS) is a promising noninvasive neuromodulatory approach, its effects on glymphatic-related neurovascular-cerebrospinal fluid (CSF) coupling in insomnia remain unclear. This study investigated the effects of tDCS on global blood oxygen level-dependent (gBOLD)-CSF coupling using resting-state functional magnetic resonance imaging (rs-fMRI) in patients with insomnia disorder and comorbid anxiety.
Methods
We conducted a 2-week, double-blind, randomized, sham-controlled trial. Patients with insomnia disorder and comorbid anxiety were randomized to receive either active or sham tDCS. The intervention consisted of 14 consecutive daily 20-min sessions delivered at 1.1 mA, targeting the left forehead and right dorsolateral prefrontal cortex. Healthy controls were frequency-matched to the overall patient cohort by age and sex. The Pittsburgh Sleep Quality Index (PSQI), Insomnia Severity Index (ISI), 14-item Hamilton Anxiety Rating Scale (HAMA-14), 17-item Hamilton Depression Rating Scale, Epworth Sleepiness Scale, 20-item Multidimensional Fatigue Inventory, polysomnography (PSG), and rs-fMRI were assessed at baseline, and patients were reassessed after treatment. The primary outcome was the post-intervention between-group difference in gBOLD-CSF coupling; clinical scales and PSG parameters were secondary outcomes.
Results
Sixty patients with insomnia disorder and comorbid anxiety and 30 healthy controls completed baseline assessments. Compared with healthy controls, patients showed significantly lower gBOLD-CSF coupling (P < 0.001, PFDR = 0.002). Coupling strength was negatively correlated with ISI, PSQI, HAMA-14 scores, and arousal index, and positively correlated with NREM stage 3 (N3) sleep duration in patients. Multivariate regression identified N3 sleep duration as an independent predictor of gBOLD-CSF coupling (β = 0.328, P = 0.005, PFDR = 0.040). After therapy, the active tDCS group showed a greater increase in gBOLD-CSF coupling than the sham tDCS group (effect size: 0.035, 95% CI: 0.011 to 0.058; Pinteraction = 0.005, PFDR = 0.014). Adverse events were mild and comparable between groups.
Conclusions
Patients with insomnia disorder and comorbid anxiety showed reduced gBOLD-CSF coupling during wakeful rs-fMRI, which was associated with subjective sleep quality, insomnia severity, anxiety level, arousal index, and N3 sleep duration. Active tDCS enhanced gBOLD-CSF coupling compared with sham stimulation, suggesting that its therapeutic effects may involve modulation of neurovascular-CSF dynamics alongside improvements in sleep and anxiety symptoms.
Clinical trial registration
ClinicalTrials.gov ID NCT07340268, retrospectively registered on January, 13, 2026.
Introduction
Insomnia disorder is a highly prevalent sleep disorder characterized by difficulty in initiating or maintaining sleep, early-morning awakening, and associated daytime dysfunction. Beyond sleep impairment, insomnia is associated with multiple physical and psychiatric conditions, particularly anxiety and other emotional disorders [1]. Anxiety frequently co-occurs with insomnia and is often accompanied by autonomic symptoms such as tension, dry mouth, sweating, and palpitations [2]. The bidirectional relationship between insomnia and anxiety may aggravate hyperarousal, sleep fragmentation, and daytime dysfunction [3].
The glymphatic system was originally described as a central nervous system clearance pathway that facilitates cerebrospinal fluid (CSF) and interstitial fluid exchange, thereby promoting the elimination of metabolic waste products, including amyloid-β, tau proteins, and inflammatory mediators [4,5,6]. Glymphatic clearance is primarily active during sleep and depends on the water channel protein aquaporin-4(AQP4) polarized on perivascular astrocytic endfeet [5, 7, 8]. Evidence suggests that insomnia disorder and anxiety may be accompanied by reduced glymphatic-related neurovascular-CSF coupling or clearance, which has been linked to a range of adverse outcomes, including psychiatric comorbidity, cognitive dysfunction, and an increased risk of neurodegenerative diseases [9, 10].
Several imaging and experimental approaches have been applied or adapted to assess glymphatic-related physiology, including contrast-enhanced magnetic resonance imaging (MRI), positron emission tomography (PET) tracers, and diffusion-based MRI measures [11,12,13]. However, these methods are limited by invasiveness, low temporal resolution, species-specific applicability, or reliance on indirect structural proxies [14, 15]. Resting-state functional magnetic resonance imaging (rs-fMRI) studies have reported temporal coupling between global blood oxygen level-dependent (gBOLD) activity and CSF dynamics [16,17,18,19]. Specifically, low-frequency oscillations of the gBOLD signal exhibit a coupled relationship with CSF flow, reflecting both the influence of cerebral blood flow on CSF flow and the role of CSF flow on the removal of metabolic waste in the brain [20]. The gBOLD-CSF coupling approach uses standard rs-fMRI to noninvasively assess the temporal relationship between gBOLD fluctuations and CSF signal changes at a seconds-scale resolution. This measure is derived from post-acquisition analysis rather than real-time monitoring. Unlike static diffusion or PET-based methods, gBOLD-CSF coupling captures dynamic neurovascular-CSF interactions that may vary with physiological states [11, 20, 21]. It therefore serves as a clinically feasible indirect rs-fMRI marker of glymphatic-related neurofluid dynamics [12].
Current treatments for insomnia disorder with comorbid anxiety include cognitive behavioral therapy for insomnia (CBT-I), pharmacological therapies, and neuromodulatory interventions [22,23,24,25]. CBT-I remains a first-line treatment but may be limited by time-intensive delivery and restricted accessibility. Pharmacological treatments include benzodiazepine receptor agonists, sedating antidepressants, melatonin-related agents, and dual orexin receptor antagonists (DORAs) [26]. DORAs provide a mechanistically distinct strategy by antagonizing orexin receptors and suppressing signaling that promotes wakefulness, and have shown efficacy and tolerability in the treatment of insomnia [27]. Nevertheless, pharmacotherapy may be limited by adverse effects, next-day impairment, drug interactions, or concerns about dependence with some medication classes [28]. These limitations highlight the need for alternative or adjunctive therapeutic strategies. Noninvasive brain stimulation techniques, including transcranial direct current stimulation (tDCS) and repetitive transcranial magnetic stimulation (rTMS), have emerged as promising interventions for insomnia and anxiety [29]. Compared with rTMS, tDCS offers advantages in ease of application and portability. tDCS modulates cortical excitability by delivering a weak direct current, typically 1 to 2 mA, through scalp electrodes, with anodal stimulation generally increasing and cathodal stimulation decreasing cortical excitability [30]. In particular, anodal stimulation of the dorsolateral prefrontal cortex has been implicated in mood regulation [31]. However, the impact of tDCS on gBOLD-CSF coupling in patients with insomnia disorder and comorbid anxiety remains unclear.
In this study, we compared gBOLD-CSF coupling between patients with insomnia disorder and comorbid anxiety and healthy controls using rs-fMRI, examined associations between coupling strength and clinical measures, and tested whether active tDCS modulated gBOLD-CSF coupling compared with sham stimulation. These analyses aimed to provide insights into neurophysiological processes that may accompany the therapeutic effects of tDCS in insomnia with anxiety.
Methods
Participants
We prospectively recruited patients with insomnia disorder and comorbid anxiety from the outpatient Department of Neurology, First Hospital of Jilin University, between February 2025 and November 2025. Diagnoses were based on the International Classification of Sleep Disorders, Third Edition, and the Diagnostic and Statistical Manual of Mental Disorders, Fifth Edition. Healthy controls were recruited during the same study period through advertisements posted in the health examination center. They were frequency-matched to the overall patient cohort at the group level according to age and sex. Written informed consent was obtained from all participants or their legal guardians prior to study enrollment. The inclusion criteria for patients were as follows: (1) Insomnia Severity Index (ISI; range 0–28) score > 8; (2) 14-item Hamilton Anxiety Rating Scale (HAMA-14; range 0–56) score ≥ 14; (3) 17-item Hamilton Depression Rating Scale (HAMD-17; range 0–52) score < 7; (4) Mini-Mental State Examination (MMSE; range 0–30) score ≥ 27.
The exclusion criteria for patients and healthy controls were as follows: (1) other major psychiatric disorders, neurological diseases, or substance use disorders; (2) other sleep disorders, such as obstructive sleep apnea, rapid eye movement sleep behavior disorder, or restless legs syndrome; (3) insomnia or sleep disturbance secondary to organic diseases, such as epilepsy, diabetes, or renal failure; (4) shift work or abnormal circadian rhythm; (5) use of medications that could affect sleep, arousal, or central nervous system function within the past month, including central nervous system stimulants, sedative hypnotics, opioid analgesics, theophylline preparations, systemic corticosteroids, antipsychotics, antidepressants, or anxiolytics; (6) contraindications to MRI examination, such as claustrophobia, metal dentures, or metallic implants; (7) clinically significant organic or structural brain lesions detected on brain MRI; and (8) inability to complete questionnaires, monitoring procedures, or treatment protocols.
After baseline assessments, including sleep and mood questionnaires, portable polysomnography (PSG), and rs-fMRI for all participants, patients were randomly assigned to the active or sham tDCS group. Sleep questionnaires, mood questionnaires, PSG, and rs-fMRI were repeated within 2 days after tDCS treatment (Fig. 1).
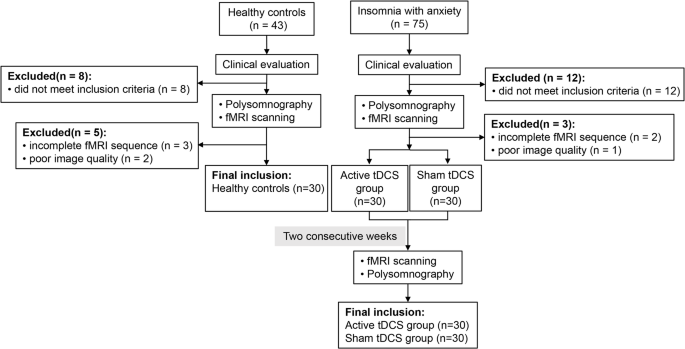
Flowcharts of the study. tDCS: transcranial direct current stimulation; fMRI: functional magnetic resonance imaging, PSG: polysomnography
Study design
This was a 2-week randomized, double-blind, sham-controlled trial. Baseline gBOLD-CSF coupling was first compared between patients with insomnia disorder and comorbid anxiety and healthy controls. Patients were then randomized 1:1 to active or sham tDCS using a stratified block design generated by an independent statistician. Group allocation was concealed in sealed envelopes and implemented by personnel not involved in enrollment or outcome assessment. No additional age or sex matching was performed between the two treatment groups. Baseline demographic variables, including age and sex, were compared between the treatment groups to assess the balance achieved by randomization. Following baseline evaluations, patients underwent once-daily tDCS for 2 weeks. The primary outcome was the post-intervention between-group difference in gBOLD-CSF coupling measured by rs-fMRI. Secondary outcomes included changes in sleep- and mood-related questionnaires and polysomnographic parameters. Safety outcomes included adverse events and their time of occurrence.
Sample size calculation
The sample size was calculated from pilot data in patients with insomnia disorder and comorbid anxiety. The expected between-group difference in the 2-week change in gBOLD-CSF coupling was 0.035, with a common standard deviation of 0.040. Because no established minimal clinically important difference is available for gBOLD-CSF coupling, this pilot-derived difference was used as the smallest effect of interest for the imaging endpoint. Although the expected direction was stronger coupling in healthy controls and greater improvement after active treatment, a two-tailed test was chosen a priori as a conservative approach that allowed for effects in either direction. With α = 0.05 and 80% power, 22 participants per group were required. To allow for 20% attrition, the target sample size was increased to 28 participants per group; therefore, 30 patients were enrolled in each treatment group. Thirty healthy controls were enrolled for the baseline case-control comparison according to available funding and scanner resources.
Clinical assessments
MRI examinations were performed in the morning to minimize potential circadian influences on glymphatic-related physiology. Demographic and clinical variables were collected within 48 h before MRI scans. The severity of insomnia symptoms and their impact on daytime functioning, as well as concerns and satisfaction regarding tDCS treatment efficacy, were assessed using the ISI [32]. Subjective sleep quality was assessed using Pittsburgh Sleep Quality Index (PSQI) [33]. Anxiety severity was evaluated using the HAMA-14 [34], and depressive symptoms were assessed using the HAMD-17 [35]. Excessive daytime sleepiness was assessed using the Epworth Sleepiness Scale (ESS) [36], and fatigue was evaluated using the 20-item Multidimensional Fatigue Inventory (MFI-20) [37].
PSG
PSG was performed in participants’ homes using a standardized portable monitoring system (NEUROTRACE, PSM-A). Participants received standardized instructions before recording, and data quality was checked by trained technicians after acquisition. The recording montage included electroencephalography (F4-M1, F3-M2, C4-M1, C3-M2, O2-M1, and O1-M2), electrooculography (E1-M2 and E2-M2), chin electromyography (Chin1-Chin2), bilateral tibialis anterior muscle electromyography, electrocardiography, nasal pressure, finger oximetry, chest and abdominal respiratory effort belts. Sleep and related events were scored by certified PSG technologists according to the American Academy of Sleep Medicine Manual, version 3.0. Parameters included total sleep time, sleep efficiency, sleep onset latency, rapid eye movement (REM) sleep latency, wake after sleep onset, stage 1 non-REM (stage N1), stage 2 NREM (stage N2), stage 3 NREM (stage N3), REM sleep, arousal index, periodic limb movement index (PLMI), apnea and hypopnea index (AHI), mean arterial oxygen saturation, minimum arterial oxygen saturation, and end-tidal CO2.
TDCS intervention
Active or sham tDCS intervention (Nexalin Technology, Inc., CA, USA) was administered under identical instructions. Participants were instructed to turn off their mobile devices and remain awake and relaxed during treatment. The anode electrode (4.5 × 4.5 cm) was placed over the left frontopolar region (Fp1 in the international 10–20 system), and the cathode electrode (4.5 × 4.5 cm) was placed over the right dorsolateral prefrontal cortex (F4). Active stimulation was delivered at 1.1 mA for 20 min once daily for 2 weeks. At the beginning and end of treatment, there is a 30 s period of current fading in and out. Sham stimulation used the same 30-s ramp-up and ramp-down sensations at the beginning and end of the 20-minute session to mimic the cutaneous sensation of active stimulation, without receiving active current during the maintenance phase. To maintain the double-blind design, the tDCS devices were preprogrammed by an independent researcher using assigned codes, ensuring that neither the administering technician nor the patient knew whether stimulation was active or sham. The healthy controls did not receive this therapy. Participants could willingly withdraw from this study at any time and choose any other medical treatments.
Explanation on medication usage status
All participants followed standardized medication restrictions to reduce confounding and ensure safety. Medication-naïve participants were required to refrain from initiating sedative-hypnotic drugs, anxiolytics, antidepressants, antipsychotics, melatonin, central stimulants, opioid analgesics, corticosteroids, or theophylline preparations until the 2-week post-treatment endpoint. Participants already receiving medications for stable non-neurological conditions, such as antihypertensive or lipid-lowering therapy, were required to maintain the same dosage and frequency throughout the study. Compliance was verified at each study visit.
Imaging data acquisition and preprocessing
All participants underwent brain MRI scanning using a single 3.0 Tesla MRI scanner (Siemens, Erlangen, Germany) equipped with a 20-channel head and neck coil, with identical acquisition protocols applied across all participants. Noise-reducing earplugs were provided to attenuate scanner noise. During rs-fMRI, participants were instructed to keep their eyes closed, remain awake, and avoid focusing on specific thoughts. Foam padding was utilized to stabilize the head and reduce motion artifacts during scanning. A trained radiologist monitored the scanning process to ensure image quality. T1-weighted structural images were acquired using a magnetization-prepared rapid acquisition gradient-echo sequence with the following parameters: repetition time (TR) of 1800 ms, echo time (TE) of 2.30 ms, matrix dimensions of 256 × 256, a voxel size of 0.92 × 0.92 × 0.92 mm3, 192 slices. The rs-fMRI data were acquired using an echo-planar imaging sequence with the following parameters: TR of 1500 ms, TE of 30 ms, flip angle of 70°, matrix dimensions of 110 × 110, field of view of 220 × 220 mm2, slice thickness of 2.0 mm, 60 slices, and 320 volumes. After discarding the first 10 volumes during preprocessing, 310 time points were retained for subsequent analysis.
Preprocessing of rs-fMRI data was performed using the Data Processing Assistant for Resting-State fMRI (DPARSF, version 6.0, http://rfmri.org/dpabi) and Statistical Parametric Mapping software (SPM12, www.fil.ion.ucl.ac.uk/spm) [38]. The first 10 volumes were discarded, followed by slice-timing correction and head-motion realignment. Scans were excluded from further analysis if maximum head motion exceeded 2.5 mm in translation or 2.5°in rotation in any direction; this criterion was applied at the scan-level, and individual frames were not scrubbed. Frame scrubbing was not applied to avoid disrupting the continuous temporal structure required for phase-based gBOLD-CSF coupling estimation. The remaining scans were spatially smoothed with a 4-mm full-width at half-maximum Gaussian kernel, linearly detrended, and temporally band-pass filtered at 0.01 to 0.1 Hz. CSF signals underwent the same preprocessing steps as gBOLD signals, except for spatial smoothing. The six rigid-body motion parameters derived from realignment were used for quality control and scan level exclusion but were not included as nuisance regressors in the primary gBOLD-CSF coupling analysis, because the analysis focused on the temporal and phase relationship between gBOLD fluctuations and CSF signal changes [39].
Definition of regions of interest (ROI)
The cortical gray matter region of interest (ROI) was defined using the Harvard-Oxford cortical structural atlas (https://neurovault.org/collections/262/) [40]. The gBOLD signal was derived by extracting and averaging BOLD signals from whole-brain cortical gray matter regions (Fig. 2A). Cortical gray matter ROIs were defined using atlas-based and subject-specific gray matter masks rather than manual segmentation. All fMRI signal analyses were conducted in individual gray matter space to minimize spatial blurring. Before averaging, voxelwise fMRI time series were z-score normalized to ensure comparable scaling across voxels. The resulting gBOLD signal primarily reflected synchronized global cortical fluctuations.

Global blood oxygen level dependent (gBOLD) and cerebrospinal fluid (CSF) coupling measured by resting-state functional magnetic resonance imaging (rs-fMRI). (A) The gBOLD signal was extracted from cortical gray matter, indicated by the red mask on the T1-weighted image. The CSF signal was obtained from the inferior CSF region, indicated by the red line on the left image and shown in the middle and right panels. (B) The gBOLD and CSF signals from a representative participant showed corresponding temporal changes. The blue trace represents the normalized gBOLD signal and corresponds to the left y-axis, whereas the red trace represents the CSF fMRI signal and corresponds to the right y-axis. For each representative CSF event, the left downward arrow indicates the preceding positive gBOLD peak, the upward arrow indicates the positive CSF peak, and the right downward arrow indicates the subsequent negative gBOLD trough. (C) The mean gBOLD-CSF cross-correlation function showed a positive peak at a lag of -3 s and a negative peak at a lag of + 4.5 s. (D) The negative derivative of the gBOLD signal was closely coupled to the CSF signal, with a positive peak around zero lag. The gray dashed line and shaded areas indicate the 95% confidence intervals of the null distribution
The CSF signal was extracted from the inferior slices of the rs-fMRI data, which are less affected by repeated radiofrequency pulses and are sensitive to CSF inflow near the inferior cerebellar and fourth ventricle regions [20]. The CSF mask was manually delineated on the inferior fMRI slice by two trained raters blinded to group allocation, and its anatomical location was confirmed using the corresponding T1-weighted structural image. Manual delineation was used because automated ventricular masks may not reliably capture the inferior CSF inflow signal targeted by this method and may instead emphasize ventricular CSF regions less specific to the inflow signal of interest. To minimize rater-dependent bias and assess reproducibility, CSF masks were independently delineated by the two raters, and inter-rater reliability was evaluated using the intraclass correlation coefficient (ICC) for gBOLD-CSF coupling estimates derived from the independently delineated CSF ROIs. Voxelwise fMRI signals within each CSF mask were z-score normalized before signal averaging to ensure consistency and comparability.
Quantification of gBOLD-CSF coupling strength
After extracting rs-fMRI signals from cortical gray matter and CSF regions, gBOLD-CSF coupling strength was quantified using lagged cross-correlation analysis. Operationally, one time series was shifted relative to the other across a predefined lag window from − 7.5 s to + 7.5 s, corresponding to -5 to + 5 TRs given the TR of 1.50 s, and the Pearson correlation coefficient between the shifted gBOLD and CSF time series was calculated at each lag. The resulting series of lag-specific Pearson correlation coefficients constituted the cross-correlation function. Based on the cross-correlation curve, the negative peak at a lag of + 4.5 s was used to quantify gBOLD-CSF coupling strength, corresponding to the inverse relationship between gBOLD fluctuations and subsequent CSF signal changes. This peak at a positive lag was selected because, under our lag convention, positive lags indicate CSF signal changes following gBOLD fluctuations, thereby preserving the physiologically interpretable temporal sequence of neurovascular-CSF coupling. The absolute value of this coupling index was used in subsequent statistical analyses to facilitate interpretation. We also estimated the cross-correlation function between the negative temporal derivative of the gBOLD signal and the CSF signal, as described previously [19]. To assess statistical significance, a permutation procedure was performed by randomly pairing gBOLD and CSF signals from different participants. This procedure was repeated 10,000 times to generate a null distribution and was implemented in MATLAB.
Statistical analysis
Statistical analyses were performed using SPSS version 27.0 (IBM Corp., Armonk, NY, USA). The normality of continuous variables was assessed using the Shapiro-Wilk test. Normally distributed variables are presented as means ± standard deviations and were compared using independent samples t tests. Non-normally distributed variables are presented as medians with interquartile ranges and were compared using Mann-Whitney U tests. Categorical variables are presented as counts and percentages and were compared using chi-square tests. gBOLD-CSF coupling strength was derived from lagged cross correlation analysis of the processed gBOLD and CSF time series and was treated as an imaging outcome variable. A general linear model was used to compare gBOLD-CSF coupling strength between patients and healthy controls, adjusting for age, sex, and education. Partial correlation analyses adjusted for age, sex, and education were used to examine associations between gBOLD-CSF coupling strength and clinical indicators. Multiple linear regression analysis was further performed to identify independent clinical predictors of gBOLD-CSF coupling strength.Repeated measures analysis of covariance was used to compare changes in gBOLD-CSF coupling strength, questionnaire scores, and polysomnographic parameters before and after tDCS treatment between the active and sham groups, with age, sex, and education included as covariates. The group-by-time interaction was used to evaluate differential treatment effects between groups. Multiple comparisons were corrected using the Benjamini-Hochberg false discovery rate method. A two-sided P value < 0.05 was considered statistically significant.
Results
Baseline characteristics
In total, 75 patients with insomnia disorder and comorbid anxiety and 43 healthy controls were screened. Fifteen patients and 13 healthy controls were excluded for various reasons. The final analysis included 60 patients and 30 healthy controls. Baseline demographic and clinical characteristics were summarized in Table 1. Compared with healthy controls, patients had significantly higher HAMA-14, PSQI, ISI, ESS and MFI-20 scores (all P < 0.001, PFDR = 0.002). No significant differences were observed between groups in age, sex, education, or BMI.
PSG parameters were summarized in Table 2. Compared with healthy controls, patients showed significant differences in total sleep time, sleep latency, sleep efficiency, wake after sleep onset, stage N1%, stage N3%, stage N1 duration, stage N2 duration, stage N3 duration, REM sleep duration, and arousal index (all P < 0.001, PFDR = 0.002). No significant differences were observed in other PSG indices after FDR correction (P > 0.05).
gBOLD signal couples with CSF signal changes
To investigate the coupling between gBOLD and CSF signals, we extracted fMRI time series from whole-brain cortical gray matter and CSF regions in all participants (Fig. 2A). Large CSF peaks were typically preceded by a positive gBOLD peak and followed by a negative gBOLD peak (Fig. 2B). Lagged cross correlation analysis revealed a significant positive peak between gBOLD and CSF signals at a lag of -3 s (r = 0.252, P < 0.001; permutation test, n = 10,000) and a significant negative peak at a lag of + 4.5 s (r = − 0.269, P < 0.001) (Fig. 2C). Furthermore, the cross-correlation between the CSF signal and the negative first-order derivative of the gBOLD signal showed a strong positive peak at zero lag (d/dt r = 0.369, P < 0.001) (Fig. 2D). These patterns indicate systematic coupling between global brain activity and CSF signal dynamics. Inter-rater reliability for gBOLD-CSF coupling estimates derived from independently delineated CSF ROIs was excellent, with average ICCs of 0.958 before treatment and 0.904 after treatment between the two researchers.
Comparison of gBOLD-CSF coupling between patients and healthy controls and its associations with clinical and sleep measures
After adjusting for age, sex and years of education, patients had significantly lower gBOLD-CSF coupling strength than healthy controls (P < 0.001, PFDR = 0.002, Fig. 3A), suggesting potential alterations in glymphatic-related neurofluid dynamics in patients with insomnia disorder and comorbid anxiety. Across all participants, gBOLD-CSF coupling was negatively correlated with age (r = − 0.360, P < 0.001, Fig. 3B). After adjusting for age, sex, and education, gBOLD-CSF coupling was negatively correlated with ISI score (r = -0.298, P = 0.021, Fig. 3C), PSQI score (r = -0.325, P = 0.011, Fig. 3D), HAMA-14 score (r = -0.264, P = 0.041, Fig. 3E), arousal index (r = -0.320, P = 0.015, Fig. 3F), and positively correlated with N3 sleep duration (r = 0.456, P < 0.001, Fig. 3G). Univariate and multivariate regression analyses showed that stage N3 duration (β = 0.328, P = 0.005, PFDR = 0.040) was independently associated with gBOLD-CSF coupling (Table 3).

Intergroup differences in global blood oxygen level dependent cerebrospinal fluid (gBOLD-CSF) coupling and its associations with age, clinical scores, and polysomnography (PSG) parameters. (A) Comparison of gBOLD-CSF between patients with insomnia disorder and comorbid anxiety and healthy controls, adjusted for age, sex and education. (B) Age was negatively correlated with gBOLD-CSF coupling across all participants. Among patients, gBOLD-CSF coupling was negatively correlated with Insomnia Severity Index (ISI) scores (C), Pittsburgh Sleep Quality Index (PSQI) scores (D), 14-item Hamilton Anxiety Rating Scale (HAMA-14) scores (E), and arousal index (F), and positively correlated with NREM stage 3 (N3) sleep duration (G), after adjustment for age, sex, and education
Effects of active versus sham tDCS in patients with insomnia disorder and comorbid anxiety
Patients in the active and sham groups were re-examined using questionnaires, PSG, and rs-fMRI within 2 days after completion of the 2-week intervention. Baseline demographic and clinical characteristics did not differ significantly between the two groups (Table 4). Compared with sham stimulation, active tDCS produced a significantly greater increase in gBOLD-CSF coupling (effect size: 0.035, 95% CI 0.011 to 0.058; Pinteraction= 0.005, PFDR = 0.014).
Active tDCS also led to greater reductions in PSQI, ISI, and HAMA-14 scores than sham stimulation (all Pinteraction < 0.001, PFDR = 0.004). Compared with sham stimulation, active tDCS was associated with greater increases in sleep efficiency (Pinteraction= 0.001, PFDR = 0.004), N3 sleep duration (Pinteraction= 0.008, PFDR = 0.019), and REM sleep duration (Pinteraction= 0.012, PFDR = 0.025), as well as greater reductions in sleep latency (Pinteraction= 0.001, PFDR = 0.004), wake after sleep onset (Pinteraction= 0.005, PFDR = 0.013), and arousal index (Pinteraction= 0.005, PFDR = 0.014). Pre- and post-treatment changes in gBOLD-CSF coupling and key clinical scale scores are shown in Fig. 4.

Changes in global blood oxygen level dependent cerebrospinal fluid (gBOLD-CSF) coupling and clinical scale scores before and after active or sham transcranial direct current stimulation (tDCS). (A) Changes in gBOLD-CSF coupling before and after the 2-week intervention in the active and sham tDCS groups. (B-D) Changes in clinical scale scores, including (B) Insomnia Severity Index (ISI), (C) Pittsburgh Sleep Quality Index (PSQI), and (D) 14-item Hamilton Anxiety Rating Scale (HAMA-14), before and after treatment. Data are shown as mean ± standard deviation for the active and sham tDCS groups
Adverse events and safety outcomes
All patients who received active or sham tDCS were included in the safety analysis. Nonserious adverse events were infrequent and consisted only of mild discomfort and itching, both of which occurred in the active tDCS group, with no significant between-group differences. No tinnitus, headache, dizziness, nausea, allergic dermatitis, phosphene perception, seizures, neurological complications, deaths, or other serious adverse events were reported in either group (Table 5).
Discussion
In this study, patients with insomnia disorder and comorbid anxiety showed reduced gBOLD-CSF coupling during wakeful rs-fMRI compared with healthy controls. Lower coupling was associated with poorer subjective sleep quality, greater insomnia severity, higher anxiety levels, higher arousal index, and shorter N3 sleep duration. Active tDCS increased gBOLD-CSF coupling relative to sham stimulation and improved several sleep and anxiety outcomes, with no significant between-group differences in adverse events. These findings suggest that insomnia with comorbid anxiety is associated with altered glymphatic-related neurofluid dynamics and that tDCS may modulate these dynamics alongside clinical improvement.
Recent studies support gBOLD-CSF coupling as a noninvasive rs-fMRI marker of coordinated neurovascular-CSF physiology [16, 19, 20]. This coupling reflects the temporal relationship between low-frequency global BOLD fluctuations and CSF signal changes and may be influenced by vasomotor activity and physiological state [6, 19, 41]. Accordingly, lagged cross-correlation analysis provides a quantitative measure of the coordination between global brain activity and CSF inflow-related signal fluctuations [16]. Our findings indicate altered gBOLD-CSF coupling in insomnia disorder with comorbid anxiety, but do not directly assess AQP4 polarization, interstitial solute transport, or metabolic waste clearance.
We found that gBOLD-CSF coupling strength was significantly reduced in patients with insomnia disorder and comorbid anxiety after adjustment for age, sex, and education. Imaging was intentionally performed during wakeful rest to obtain a standardized rs-fMRI measure that could be acquired consistently in both patients and healthy controls. Nevertheless, because glymphatic-related neurofluid dynamics are strongly influenced by sleep state, coupling measured during wakefulness may differ from that during NREM or REM sleep. Therefore, our findings should be interpreted as reflecting wakeful resting-state gBOLD-CSF coupling rather than as a direct measure of sleep stage-specific glymphatic activity.
The relationship between lower gBOLD-CSF coupling and shorter stage N3 duration is biologically plausible. During slow-wave sleep, neural slow waves, hemodynamic oscillations, and CSF inflow can become strongly synchronized. Reduced stage N3 sleep may therefore shorten the temporal window during which sleep-related neurofluid dynamics are most pronounced. This interpretation is consistent with evidence that sleep disruption is associated with Alzheimer-related biomarker changes and that glymphatic and lymphatic fluid flow is regulated by circadian physiology [42, 43]. Conversely, an elevated arousal index reflects sleep fragmentation and instability, which may disrupt sustained physiological states that support coordinated neurovascular-CSF oscillations. These alterations may partly explain why lower coupling was associated with poorer subjective sleep quality, greater insomnia severity, and higher anxiety levels.
Furthermore, anxiety may contribute to altered gBOLD-CSF coupling through hyperarousal, autonomic dysregulation, and altered limbic-prefrontal control circuits, potentially preventing complete disengagement from hyperarousal states during sleep and interfering with the transition into slow-wave sleep [29]. Such disrupted sleep architecture may reduce the temporal windows that support glymphatic-related neurofluid physiology [44]. Altered clearance-related physiology may, in turn, be associated with neuroinflammatory mediators and metabolic waste products, potentially exacerbating sleep disturbances, anxiety symptoms, and neurodegenerative vulnerability [5, 45, 46]. Thus, attenuated gBOLD-CSF coupling may represent a potential nexus linking sleep microstructure, psychopathology, and coordinated neurovascular-CSF physiology. The age-related decline in coupling strength is consistent with prior evidence of age-dependent glymphatic alterations, including reduced slow-wave sleep, lower CSF turnover, and disrupted AQP4 polarization [47,48,49]. However, these mechanisms should be interpreted cautiously because rs-fMRI cannot directly assess AQP4 polarization, solute transport, or molecular clearance.
Our findings suggest that active tDCS has potential to improve sleep status and increase gBOLD-CSF coupling in patients with insomnia disorder and comorbid anxiety. Previous studies have reported that tDCS may alleviate insomnia symptoms and modulate anxiety- and mood-related neural networks [29,30,31]. These effects may be particularly relevant in patients with comorbid insomnia and anxiety, in whom sleep disturbance and emotional hyperarousal may mutually reinforce each other. A recent study from our institution also reported reduced gBOLD-CSF coupling in patients with insomnia disorder and increased coupling after tDCS treatment [50]. The present sham-controlled study extends these observations by focusing on patients with comorbid anxiety and by integrating PSG-derived sleep architecture with gBOLD-CSF coupling.
Building on these findings, we propose a cautious mechanistic hypothesis: tDCS may modulate cortical excitability, sleep-wake regulation, emotion-related fronto-limbic circuits, and arousal, thereby improving sleep architecture and indirectly enhancing coordinated neurovascular-CSF physiology [20]. This interpretation is consistent with evidence that global brain activity, hemodynamic oscillations, and CSF signal fluctuations are temporally coupled, particularly during sleep-related physiological states [51]. tDCS may also induce sustained and network-wide cerebral hemodynamic responses, providing a potential pathway through which neuromodulation could influence gBOLD-CSF coupling [52, 53]. However, whether changes in gBOLD-CSF coupling are driven directly by neuromodulation or indirectly through improvements in sleep and anxiety symptoms remains to be clarified in future studies.
The magnitude of symptom improvement was also clinically relevant. The active tDCS group showed a mean ISI reduction of 7.03 points, exceeding the reported 6-point minimal clinically important difference and approaching the commonly used 8-point threshold for treatment response. The mean PSQI reduction of 6.16 points also exceeded clinically meaningful change values reported in insomnia intervention studies, supporting both clinical and statistical improvement [32, 54, 55].
Several limitations should be emphasized. First, the sample size was relatively small and participants were recruited from a single center; larger multicenter studies are needed to confirm these findings. Second, the lack of long-term follow-up limits conclusions regarding the durability of the clinical and imaging effects of tDCS. Third, only one stimulation intensity, session duration, and electrode montage were tested; therefore, potential dose-response effects remain unclear. Fourth, gBOLD-CSF coupling is a putative indirect rs-fMRI marker of glymphatic-related neurofluid dynamics rather than a direct measure of glymphatic clearance. Fifth, objective vigilance monitoring with simultaneous EEG or eye tracking was not performed during rs-fMRI; although participants were instructed to remain awake, unrecognized drowsiness could have influenced coupling estimates. Sixth, nuisance regression was omitted to preserve the global BOLD and CSF signals of interest, but residual physiological noise or motion-related effects may remain. Future studies should incorporate physiological recordings, objective vigilance monitoring, alternative preprocessing pipelines, and sensitivity analyses to confirm the robustness of these findings.
Conclusions
This study showed that gBOLD-CSF coupling strength was significantly reduced in patients with insomnia disorder and comorbid anxiety and was associated with sleep architecture and anxiety severity. Active tDCS increased gBOLD-CSF coupling relative to sham stimulation and produced clinically meaningful improvements in subjective sleep outcomes. These findings suggest that tDCS may modulate glymphatic-related neurofluid dynamics and may represent a promising therapeutic strategy for insomnia disorder accompanied by anxiety, although further studies are needed to clarify the underlying mechanisms.
Data availability
The deidentified data used and analyzed during this study are available from the corresponding author on reasonable request.
Abbreviations
- rs-fMRI:
-
Resting-state functional magnetic resonance imaging
- gBOLD:
-
Global blood oxygen level-dependent
- CSF:
-
Cerebrospinal fluid
- AQP4:
-
Aquaporin-4
- ISI:
-
Insomnia Severity Index
- PSQI:
-
Pittsburgh Sleep Quality Index
- PSG:
-
Polysomnography
- NREM:
-
Non-rapid eye movement
- REM:
-
Rapid eye movement
- tDCS:
-
Transcranial direct current stimulation
References
Smith MT, Huang MI, Manber R. Cognitive behavior therapy for chronic insomnia occurring within the context of medical and psychiatric disorders. Clin Psychol Rev. 2005;25:559–92. https://doi.org/10.1016/j.cpr.2005.04.004.
Palagini L, Hertenstein E, Riemann D, Nissen C. Sleep, insomnia and mental health. J Sleep Res. 2022;31:e13628. https://doi.org/10.1111/jsr.13628.
Taylor DJ, Lichstein KL, Durrence HH, Reidel BW, Bush AJ. Epidemiology of insomnia, depression, and anxiety. Sleep. 2005;28:1457–64. https://doi.org/10.1093/sleep/28.11.1457.
Rasmussen MK, Mestre H, Nedergaard M. The glymphatic pathway in neurological disorders. Lancet Neurol. 2018;17:1016–24. https://doi.org/10.1016/S1474-4422(18)30318-1.
Iliff JJ, Wang M, Liao Y, Plogg BA, Peng W, Gundersen GA, et al. A paravascular pathway facilitates CSF flow through the brain parenchyma and the clearance of interstitial solutes, including amyloid β. Sci Transl Med. 2012;4. https://doi.org/10.1126/scitranslmed.3003748.
Iliff JJ, Wang M, Zeppenfeld DM, Venkataraman A, Plog BA, Liao Y, et al. Cerebral arterial pulsation drives paravascular CSF–interstitial fluid exchange in the murine brain. J Neurosci. 2013;33:18190–9. https://doi.org/10.1523/JNEUROSCI.1592-13.2013.
Lohela TJ, Lilius TO, Nedergaard M. The glymphatic system: Implications for drugs for central nervous system diseases. Nat Rev Drug Discov. 2022;21:763–79. https://doi.org/10.1038/s41573-022-00500-9.
Xie L, Kang H, Xu Q, Chen MJ, Liao Y, Thiyagarajan M, et al. Sleep drives metabolite clearance from the adult brain. Science. 2013;342:373–7. https://doi.org/10.1126/science.1241224.
Qian R, Wang L, Fan S, Xu X, Yu Y, Qi L, et al. Reduced coupling between global signal and cerebrospinal fluid inflow in patients with generalized anxiety disorder: A resting state functional MRI study. J Affect Disord. 2025;390:119851. https://doi.org/10.1016/j.jad.2025.119851.
Sangalli L, Boggero IA. The impact of sleep components, quality and patterns on glymphatic system functioning in healthy adults: A systematic review. Sleep Med. 2023;101:322–49. https://doi.org/10.1016/j.sleep.2022.11.012.
Taoka T, Masutani Y, Kawai H, Nakane T, Matsuoka K, Yasuno F, et al. Evaluation of glymphatic system activity with the diffusion MR technique: Diffusion tensor image analysis along the perivascular space (DTI-ALPS) in alzheimer’s disease cases. Jpn J Radiol. 2017;35:172–8. https://doi.org/10.1007/s11604-017-0617-z.
Ringstad G, Valnes LM, Dale AM, Pripp AH, Vatnehol S-AS, Emblem KE, et al. Brain-wide glymphatic enhancement and clearance in humans assessed with MRI. JCI Insight. 2018;3:e121537. https://doi.org/10.1172/jci.insight.121537.
Benveniste H, Lee H, Ozturk B, Chen X, Koundal S, Vaska P, et al. Glymphatic cerebrospinal fluid and solute transport quantified by MRI and PET imaging. Neuroscience. 2021;474:63–79. https://doi.org/10.1016/j.neuroscience.2020.11.014.
Ayyappan K, Unger L, Kitchen P, Bill RM, Salman MM. Measuring glymphatic function: Assessing the toolkit. Neural Regeneration Res. 2026;21:534–41. https://doi.org/10.4103/NRR.NRR-D-24-01013.
Zhang Y, Song J, He X-Z, Xiong J, Xue R, Ge J-H, et al. Quantitative determination of glymphatic flow using spectrophotofluorometry. Neurosci Bull. 2020;36:1524–37. https://doi.org/10.1007/s12264-020-00548-w.
Wang Z, Song Z, Zhou C, Fang Y, Gu L, Yang W, et al. Reduced coupling of global brain function and cerebrospinal fluid dynamics in parkinson’s disease. J Cereb Blood Flow Metab. 2023;43:1328–39. https://doi.org/10.1177/0271678X231164337.
Liu X. Decoupling between brain activity and cerebrospinal fluid movement in neurological disorders. J Magn Reson Imaging. 2024;60:1743–52. https://doi.org/10.1002/jmri.29148.
Han F, Lee J, Chen X, Ziontz J, Ward T, Landau SM, et al. Global brain activity and its coupling with cerebrospinal fluid flow is related to tau pathology. Alzheimers Dement. 2024;20:8541–55. https://doi.org/10.1002/alz.14296.
Han F, Brown GL, Zhu Y, Belkin-Rosen AE, Lewis MM, Du G, et al. Decoupling of global brain activity and cerebrospinal fluid flow in parkinson’s disease cognitive decline. Mov Disord. 2021;36:2066–76. https://doi.org/10.1002/mds.28643.
Fultz NE, Bonmassar G, Setsompop K, Stickgold RA, Rosen BR, Polimeni JR, et al. Coupled electrophysiological, hemodynamic, and cerebrospinal fluid oscillations in human sleep. Science. 2019;366:628–31. https://doi.org/10.1126/science.aax5440.
Kiviniemi V, Wang X, Korhonen V, Keinänen T, Tuovinen T, Autio J, et al. Ultra-fast magnetic resonance encephalography of physiological brain activity – glymphatic pulsation mechanisms? J Cereb Blood Flow Metab. 2016;36:1033–45. https://doi.org/10.1177/0271678X15622047.
Edinger JD, Olsen MK, Stechuchak KM, Means MK, Lineberger MD, Kirby A, et al. Cognitive behavioral therapy for patients with primary insomnia or insomnia associated predominantly with mixed psychiatric disorders: A randomized clinical trial. Sleep. 2009;32:499–510. https://doi.org/10.1093/sleep/32.4.499.
Sateia MJ, Buysse DJ, Krystal AD, Neubauer DN, Heald JL. Clinical practice guideline for the pharmacologic treatment of chronic insomnia in adults: An American academy of sleep medicine clinical practice guideline. J Clin Sleep Med. 2017;13:307–49. https://doi.org/10.5664/jcsm.6470.
Bystritsky A, Kerwin L, Feusner J. A pilot study of cranial electrotherapy stimulation for generalized anxiety disorder. J Clin Psychiatry. 2008;69:412–7. https://doi.org/10.4088/JCP.v69n0311.
Li J, Li A, Jiao J, Hu K, Jiang Y, Hu X, et al. Effects of high-definition transcranial direct current stimulation for the treatment of chronic insomnia: A randomized, double-blind, controlled trial. Sci Rep. 2025;15:26574. https://doi.org/10.1038/s41598-025-09304-4.
Riemann D, Espie CA, Altena E, Arnardottir ES, Baglioni C, Bassetti CLA, et al. The european insomnia guideline: An update on the diagnosis and treatment of insomnia 2023. J Sleep Res. 2023;32:e14035. https://doi.org/10.1111/jsr.14035.
Mogavero MP, Silvani A, Lanza G, DelRosso LM, Ferini-Strambi L, Ferri R. Targeting orexin receptors for the treatment of insomnia: From physiological mechanisms to current clinical evidence and recommendations. Nat Sci Sleep. 2023;15:17–38. https://doi.org/10.2147/NSS.S201994.
Riemann D, Benz F, Dressle RJ, Espie CA, Johann AF, Blanken TF, et al. Insomnia disorder: State of the science and challenges for the future. J Sleep Res. 2022;31:e13604. https://doi.org/10.1111/jsr.13604.
Chellappa SL, Aeschbach D. Sleep and anxiety: From mechanisms to interventions. Sleep Med Rev. 2022;61:101583. https://doi.org/10.1016/j.smrv.2021.101583.
Wang J, Luo H, Schülke R, Geng X, Sahakian BJ, Wang S. Is transcranial direct current stimulation, alone or in combination with antidepressant medications or psychotherapies, effective in treating major depressive disorder? A systematic review and meta-analysis. BMC Med. 2021;19:319. https://doi.org/10.1186/s12916-021-02181-4.
Brunoni AR, Moffa AH, Sampaio-Junior B, Borrione L, Moreno ML, Fernandes RA, et al. Trial of electrical direct-current therapy versus escitalopram for depression. N Engl J Med. 2017;376:2523–33. https://doi.org/10.1056/NEJMoa1612999.
Morin CM, Belleville G, Bélanger L, Ivers H. The insomnia severity index: Psychometric indicators to detect insomnia cases and evaluate treatment response. Sleep. 2011;34:601–8. https://doi.org/10.1093/sleep/34.5.601.
Buysse DJ, Reynolds CF, Monk TH, Berman SR, Kupfer DJ. The pittsburgh sleep quality index: A new instrument for psychiatric practice and research. Psychiatry Res. 1989;28:193–213. https://doi.org/10.1016/0165-1781(89)90047-4.
Maier W, Buller R, Philipp M, Heuser I. The hamilton anxiety scale: Reliability, validity and sensitivity to change in anxiety and depressive disorders. J Affect Disord. 1988;14:61–8. https://doi.org/10.1016/0165-0327(88)90072-9.
Müller MJ, Dragicevic A. Standardized rater training for the hamilton depression rating scale (HAMD-17) in psychiatric novices. J Affect Disord. 2003;77:65–9. https://doi.org/10.1016/S0165-0327(02)00097-6.
Kendzerska TB, Smith PM, Brignardello-Petersen R, Leung RS, Tomlinson GA. Evaluation of the measurement properties of the epworth sleepiness scale: A systematic review. Sleep Med Rev. 2014;18:321–31. https://doi.org/10.1016/j.smrv.2013.08.002.
Hinz A, Benzing C, Brähler E, Zenger M, Herzberg PY, Finck C, et al. Psychometric properties of the multidimensional fatigue inventory (MFI-20), derived from seven samples. J Pain Symptom Manag. 2020;59:717–23. https://doi.org/10.1016/j.jpainsymman.2019.12.005.
Yan C-G, Wang X-D, Zuo X-N, Zang Y-F. Data processing & analysis for (resting-state) brain imaging. Neuroinform. 2016;14:339–51. https://doi.org/10.1007/s12021-016-9299-4.
Zhang Y, Zhang R, Wang S, Hong H, Jiaerken Y, Li K, et al. Reduced coupling between the global blood-oxygen-level-dependent signal and cerebrospinal fluid inflow is associated with the severity of small vessel disease. NeuroImage: Clin. 2022;36:103229. https://doi.org/10.1016/j.nicl.2022.103229.
Desikan RS, Ségonne F, Fischl B, Quinn BT, Dickerson BC, Blacker D, et al. An automated labeling system for subdividing the human cerebral cortex on MRI scans into gyral based regions of interest. NeuroImage. 2006;31:968–80. https://doi.org/10.1016/j.neuroimage.2006.01.021.
Mestre H, Tithof J, Du T, Song W, Peng W, Sweeney AM, et al. Flow of cerebrospinal fluid is driven by arterial pulsations and is reduced in hypertension. Nat Commun. 2018;9:4878. https://doi.org/10.1038/s41467-018-07318-3.
Olsson M, Ärlig J, Hedner J, Blennow K, Zetterberg H. Sleep deprivation and plasma biomarkers for alzheimer’s disease. Sleep Med. 2019;57:92–3. https://doi.org/10.1016/j.sleep.2018.12.029.
Hablitz LM, Plá V, Giannetto M, Vinitsky HS, Stæger FF, Metcalfe T, et al. Circadian control of brain glymphatic and lymphatic fluid flow. Nat Commun. 2020;11:4411. https://doi.org/10.1038/s41467-020-18115-2.
Nedergaard M, Goldman SA. Glymphatic failure as a final common pathway to dementia. Science. 2020;370:50–6. https://doi.org/10.1126/science.abb8739.
Felger JC. Imaging the role of inflammation in mood and anxiety-related disorders. CN. 2018;16:533–58. https://doi.org/10.2174/1570159X15666171123201142.
Miao Y, Wang J, Li X, Guo J, Ekblom MM, Sindi S, et al. Poor sleep health is associated with older brain age: The role of systemic inflammation. eBioMedicine. 2025;120:105941. https://doi.org/10.1016/j.ebiom.2025.105941.
Varga AW, Wohlleber ME, Giménez S, Romero S, Alonso JF, Ducca EL, et al. Reduced slow-wave sleep is associated with high cerebrospinal fluid Aβ42 levels in cognitively normal elderly. Sleep. 2016;39:2041–8. https://doi.org/10.5665/sleep.6240.
Gleiser C, Wagner A, Fallier-Becker P, Wolburg H, Hirt B, Mack A. Aquaporin-4 in astroglial cells in the CNS and supporting cells of sensory organs—a comparative perspective. IJMS. 2016;17:1411. https://doi.org/10.3390/ijms17091411.
Kress BT, Iliff JJ, Xia M, Wang M, Wei HS, Zeppenfeld D, et al. Impairment of paravascular clearance pathways in the aging brain. Ann Neurol. 2014;76:845–61. https://doi.org/10.1002/ana.24271.
Liu D, Chen X, Zhang X, Peng J, Zhou H, Lan W. Alterations in coupling between global brain activity and cerebrospinal fluid flow in patients with insomnia disorder before and after transcranial direct current stimulation: A resting-state functional MRI study. Front Psychiatry 16:1705101. https://doi.org/10.3389/fpsyt.2025.1705101.
Mateo C, Knutsen PM, Tsai PS, Shih AY, Kleinfeld D. Entrainment of arteriole vasomotor fluctuations by neural activity is a basis of blood-oxygenation-level-dependent resting-state connectivity. Neuron. 2017;96:936–e9483. https://doi.org/10.1016/j.neuron.2017.10.012.
Liu ML, Karabanov AN, Piek M, Petersen ET, Thielscher A, Siebner HR. Short periods of bipolar anodal TDCS induce no instantaneous dose-dependent increase in cerebral blood flow in the targeted human motor cortex. Sci Rep. 2022;12:9580. https://doi.org/10.1038/s41598-022-13091-7.
Zheng X, Alsop DC, Schlaug G. Effects of transcranial direct current stimulation (tDCS) on human regional cerebral blood flow. NeuroImage. 2011;58:26–33. https://doi.org/10.1016/j.neuroimage.2011.06.018.
Yang M, Morin CM, Schaefer K, Wallenstein GV. Interpreting score differences in the insomnia severity index: Using health-related outcomes to define the minimally important difference. Curr Med Res Opin. 2009;25:2487–94. https://doi.org/10.1185/03007990903167415.
Qin Z, Zhu Y, Shi D-D, Chen R, Li S, Wu J. The gap between statistical and clinical significance: Time to pay attention to clinical relevance in patient-reported outcome measures of insomnia. BMC Med Res Methodol. 2024;24:177. https://doi.org/10.1186/s12874-024-02297-0.
Acknowledgements
The authors would like to thank Hongwei Zhou for the acquisition of functional magnetic resonance imaging.
Funding
The article was supported by the Brain Science and Brain-like Intelligence Technology-National Science and Technology Major Project (Grant number 2021ZD0204303) and the National Key R&D Program of China (Grant number 2022YFC2503904) to ZW.
Author information
Authors and Affiliations
Contributions
YNZ and ZW conceptualized the study. YNZ, QQS, and WRL performed the experiments. YNZ, QQS, YRW, and LJC analyzed and interpreted the data. YNZ and ZW wrote and revised the manuscript. ZW provided supervision. YNZ and QQS contributed equally to this work and are co-first authors. All the authors approved the submitted version of the article.
Corresponding author
Ethics declarations
Ethics approval and consent to participate
The study was approved by the Ethics Committee of the First Hospital of Jilin University (Approval No.24K099-001) and followed the guidelines of the Declaration of Helsinki (1964). Written informed forms were obtained from all patients.
Consent for publication
Not applicable.
Competing interests
The authors declare no competing interests.
Additional information
Publisher’s note
Springer Nature remains neutral with regard to jurisdictional claims in published maps and institutional affiliations.
Rights and permissions
Open Access This article is licensed under a Creative Commons Attribution-NonCommercial-NoDerivatives 4.0 International License, which permits any non-commercial use, sharing, distribution and reproduction in any medium or format, as long as you give appropriate credit to the original author(s) and the source, provide a link to the Creative Commons licence, and indicate if you modified the licensed material. You do not have permission under this licence to share adapted material derived from this article or parts of it. The images or other third party material in this article are included in the article’s Creative Commons licence, unless indicated otherwise in a credit line to the material. If material is not included in the article’s Creative Commons licence and your intended use is not permitted by statutory regulation or exceeds the permitted use, you will need to obtain permission directly from the copyright holder. To view a copy of this licence, visit http://creativecommons.org/licenses/by-nc-nd/4.0/.
About this article

Cite this article
Zhang, Y., Sun, Q., Zhang, X. et al. Transcranial direct current stimulation improves reduced global BOLD-CSF coupling in patients with insomnia disorder and comorbid anxiety: a resting-state functional MRI study. BMC Psychiatry 26, 670 (2026). https://doi.org/10.1186/s12888-026-08304-6
Received:
Accepted:
Published:
Version of record:
DOI: https://doi.org/10.1186/s12888-026-08304-6